Tutorial
About sRNA Analyst
Using sRNA Analyst
What is sRNA Analyst?
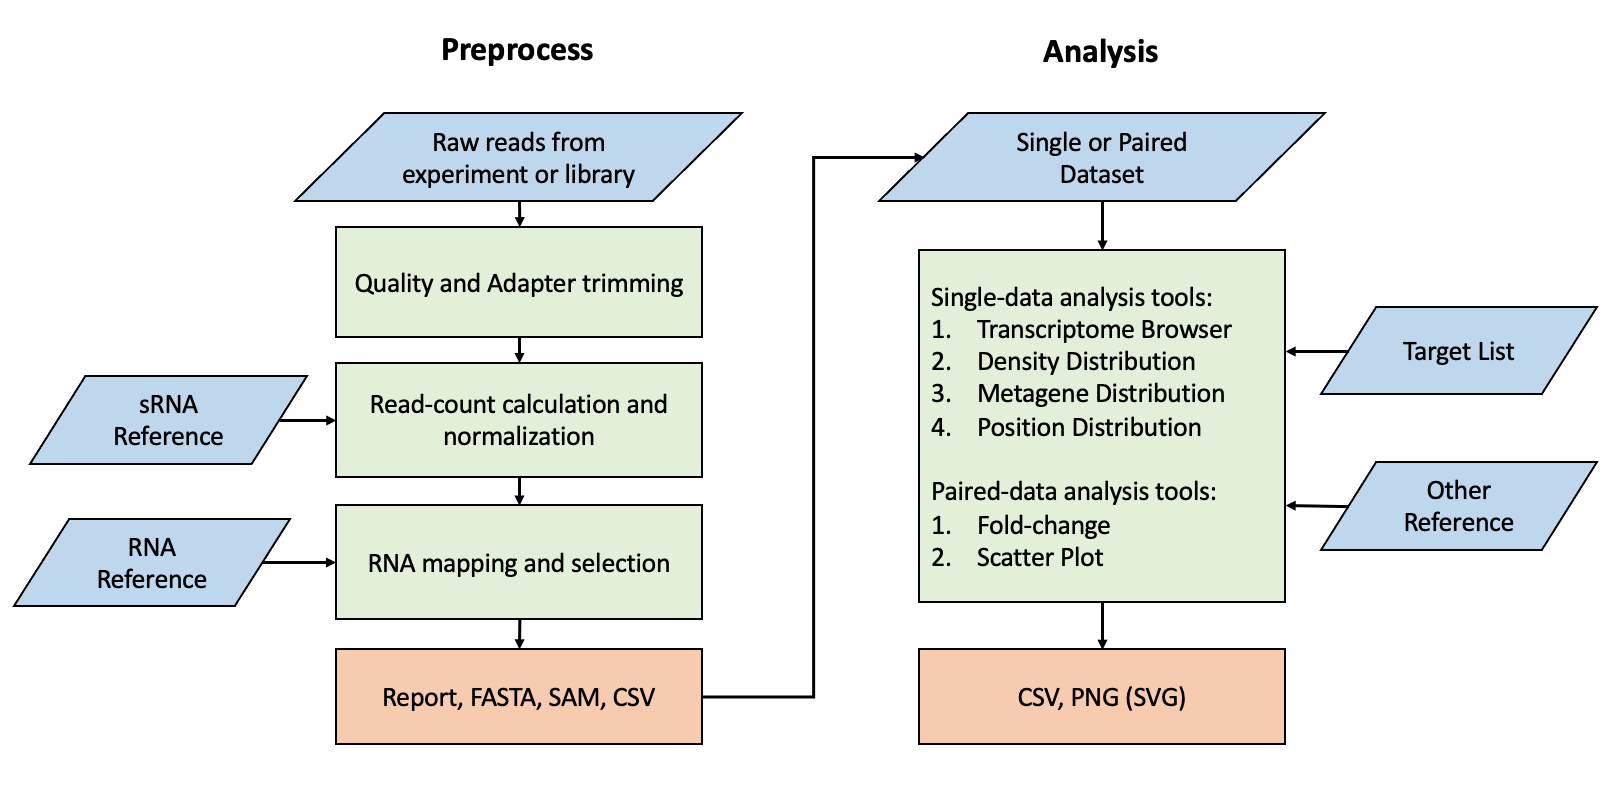
sRNA Analyst is an pipeline analysis tool optimized for sRNA-seq data, including a complete data preprocessing workflow, downstream analysis tools, and a collection of sRNA references and experimental datasets.

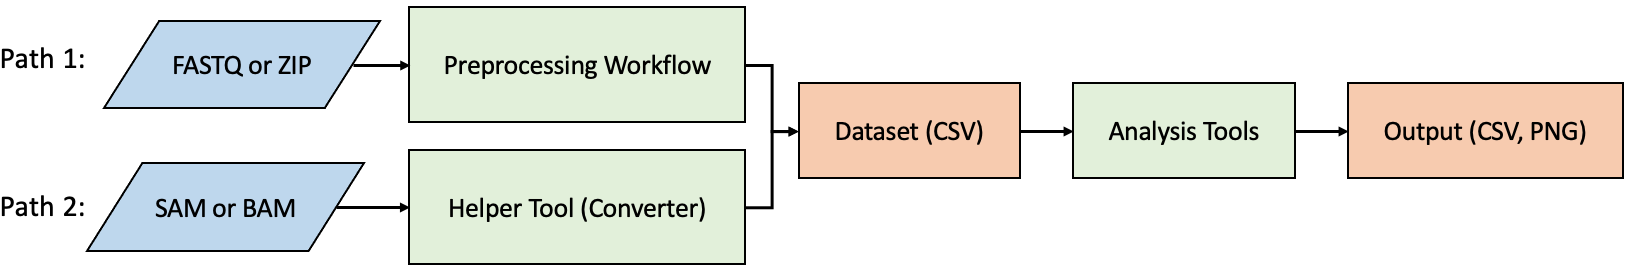
- The preprocessing tools currently offer a basic workflow for small RNA, including adapter trimming, quality control, length filtering, normalization, and reference alignment. It provides additional helper tools for processing reference files or converting a SAM/BAM file to CSV format for downstream analysis.
- The downstream analysis tools include Transcriptome Browser, Metagene, Region Density Distribution, Position (head/tail/start codon/stop codon) Readcount Distribution, Fold-change, and Scatter Plot, assisting in observing the distribution of small RNA on specific target RNA under different datasets.
- The database contains experimental datasets primarily focused on C.elegans, along with common model organism miRNA, mRNA references, and partial target gene lists of worm, including Soma target, Germline target, WAGO and CSR-1 target.
Motivation of developing sRNA Analyst
Up to the present, there have been numerous pipeline analysis tools for small RNA, with a predominant focus on analyzing miRNA and piRNA. However, there is a lack of web-based tools capable of rapidly generating analyses such as metagene profiles, region density, or position distributions. Moreover, there is a scarcity of tools that can independently handle both data preprocessing and downstream analysis. Therefore, we developed a tool to assist biologists to swiftly perform data preprocessing, RNA profiling, identify differentially expressed transcripts, or independently conduct other functional analyses directly from experimental FASTQ or SAM/BAM files.
Impact of sRNA Analyst
sRNA Analyst is the first web-based analysis tool capable of examining small RNA metagene profiles, region density, and position distributions. It provides a user-friendly interface that allows users to click and perform data preprocessing for sRNA-seq or use other pipelines that can output SAM/BAM files. With just the provision of an intermediate CSV file, users can conduct downstream functional analyses anytime, anywhere. This enables the observation of sRNA abundance, differential expression, or the examination of distribution and fold-change variations at the transcript level for specific target lists across different datasets.


Quick Start
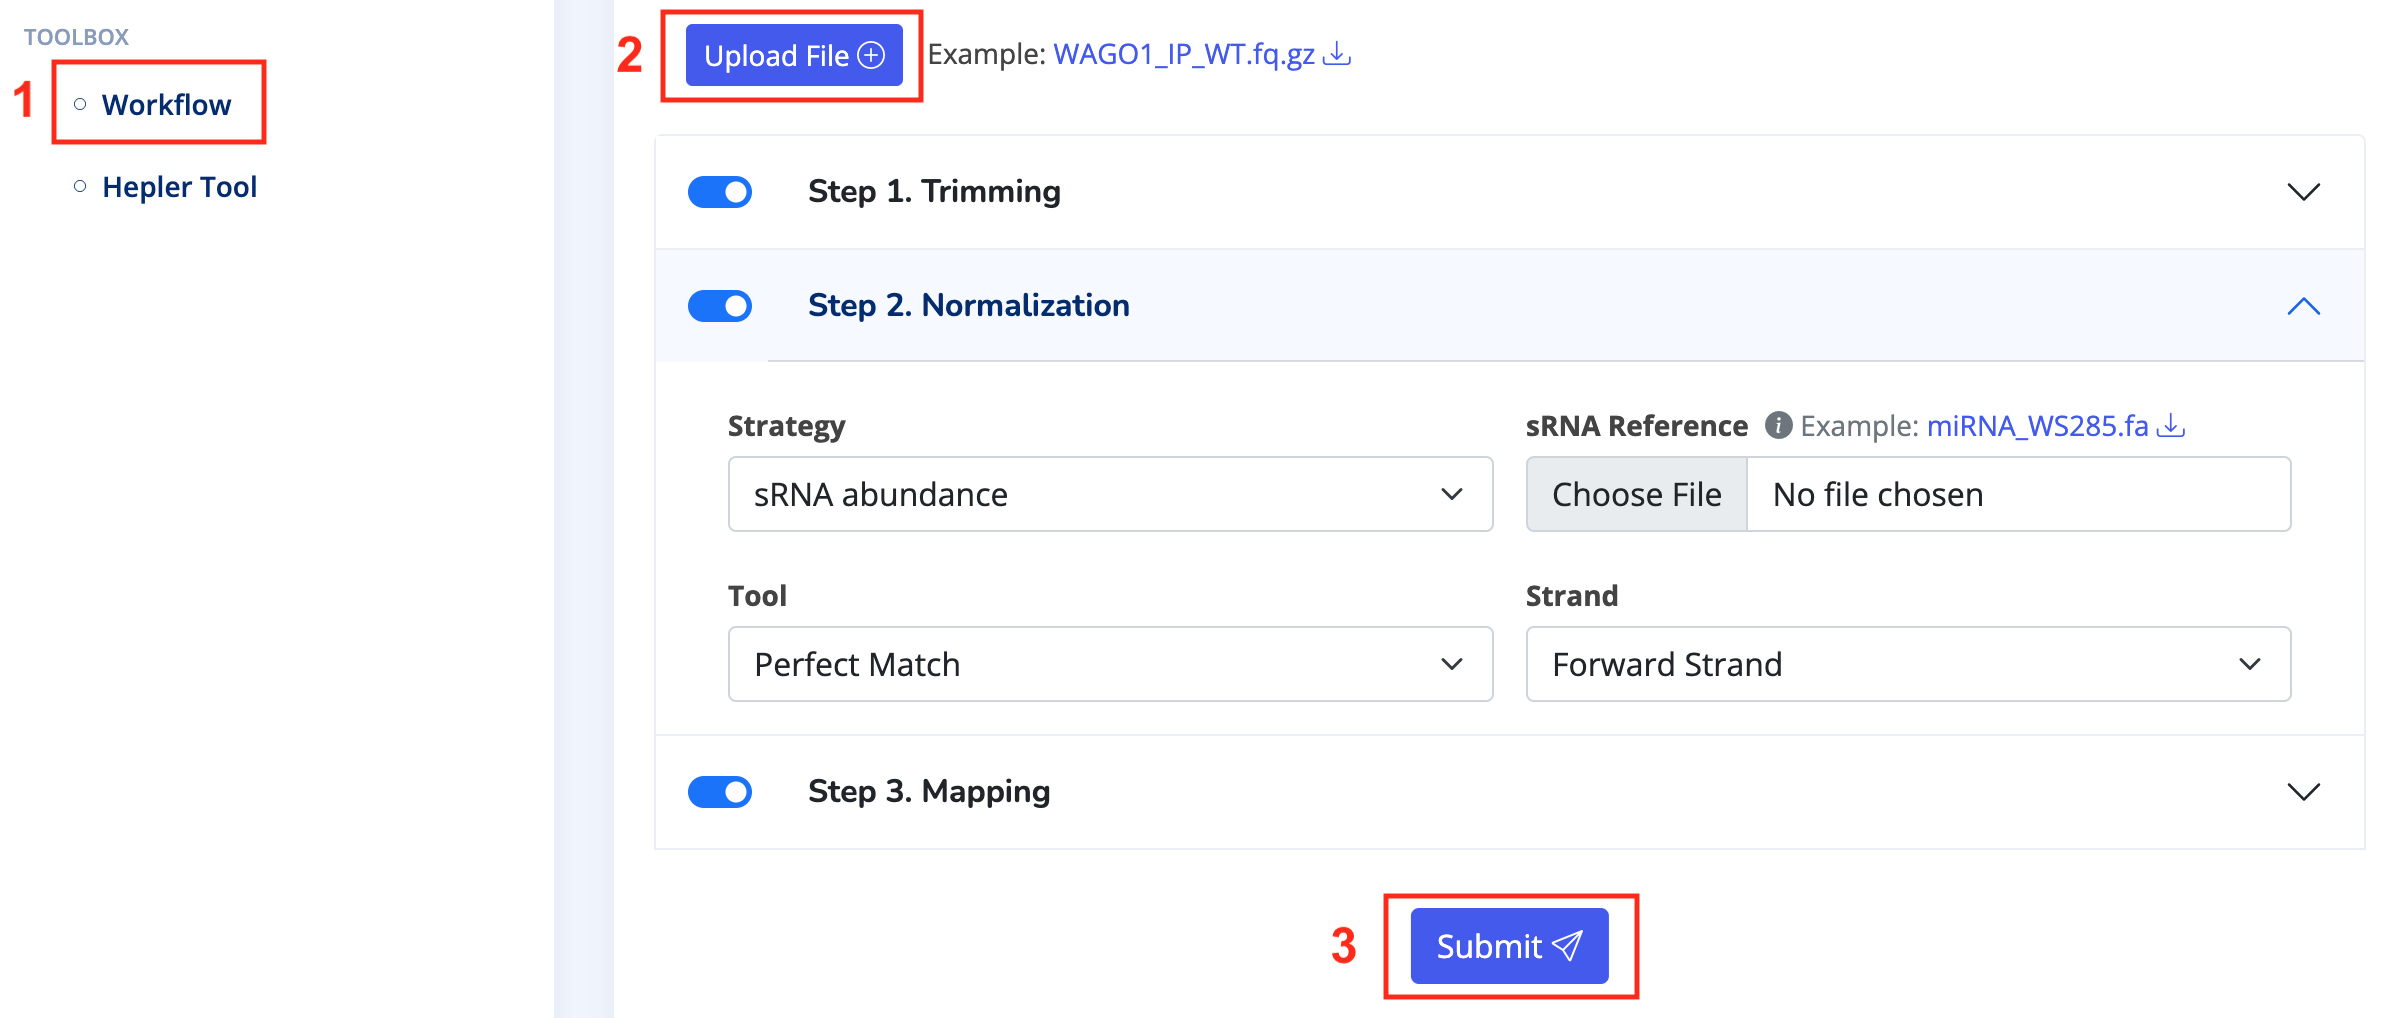
- Navigate to the "Preprocess Page," choose the workflow in the "Toolbox," and upload your compressed FASTQ file in the settings. Then, individually select your desired parameters for Trimming, Normalization, and Mapping. Once configured, click "Submit" and wait a few minutes until the results appear.
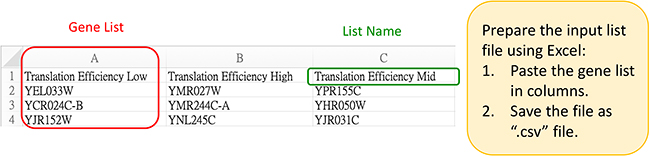
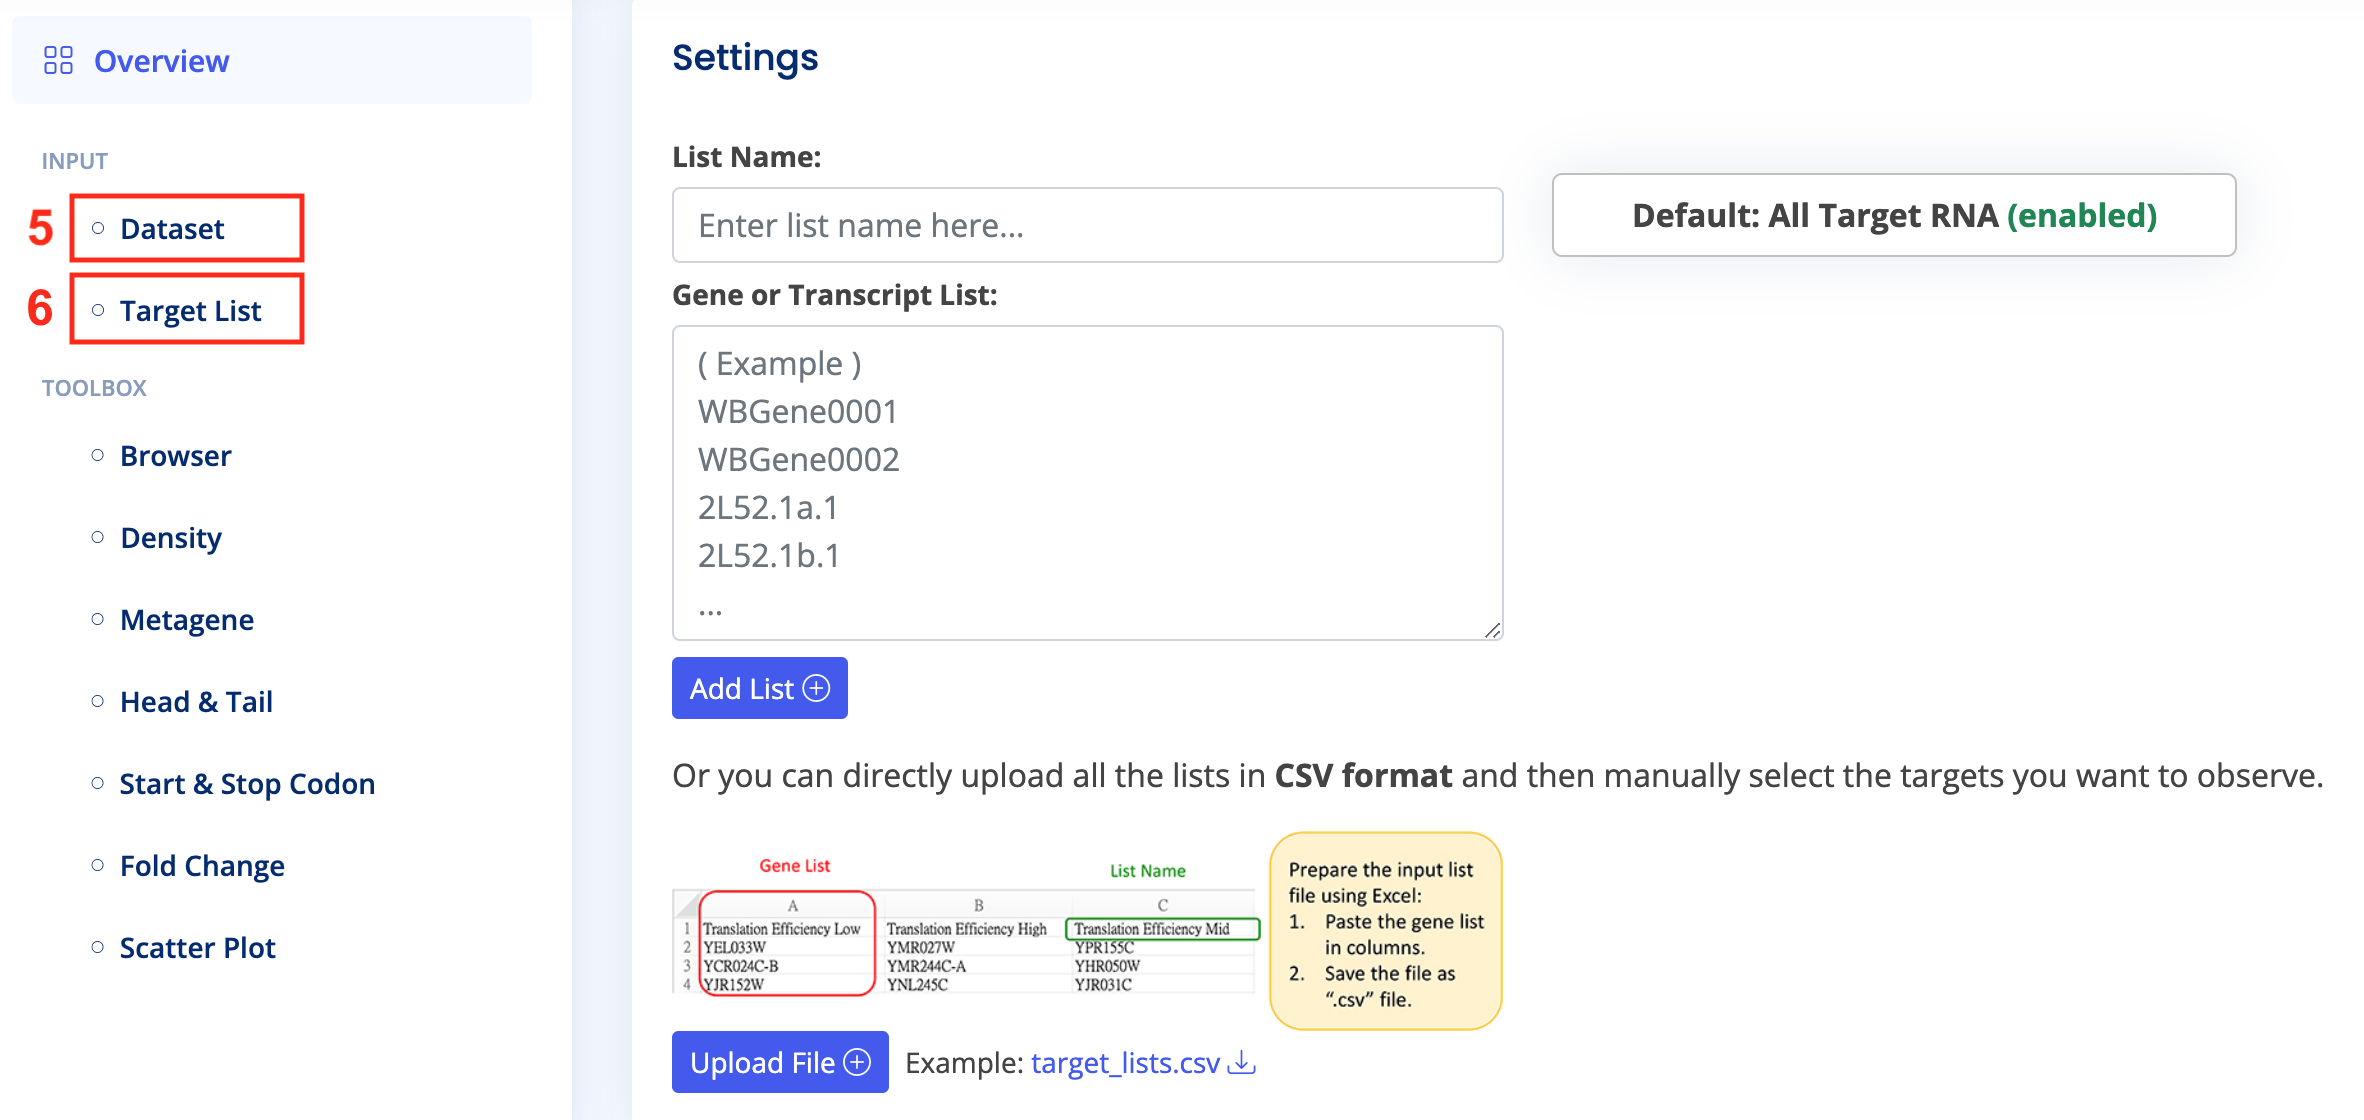
- Download the final CSV file. After entering the "Analysis Page," select "Input > Dataset" and upload the CSV file based on your requirements for single or paired data. Choose "Input > Target List" and upload the target transcript list for analysis, or use the default "All Target RNA."
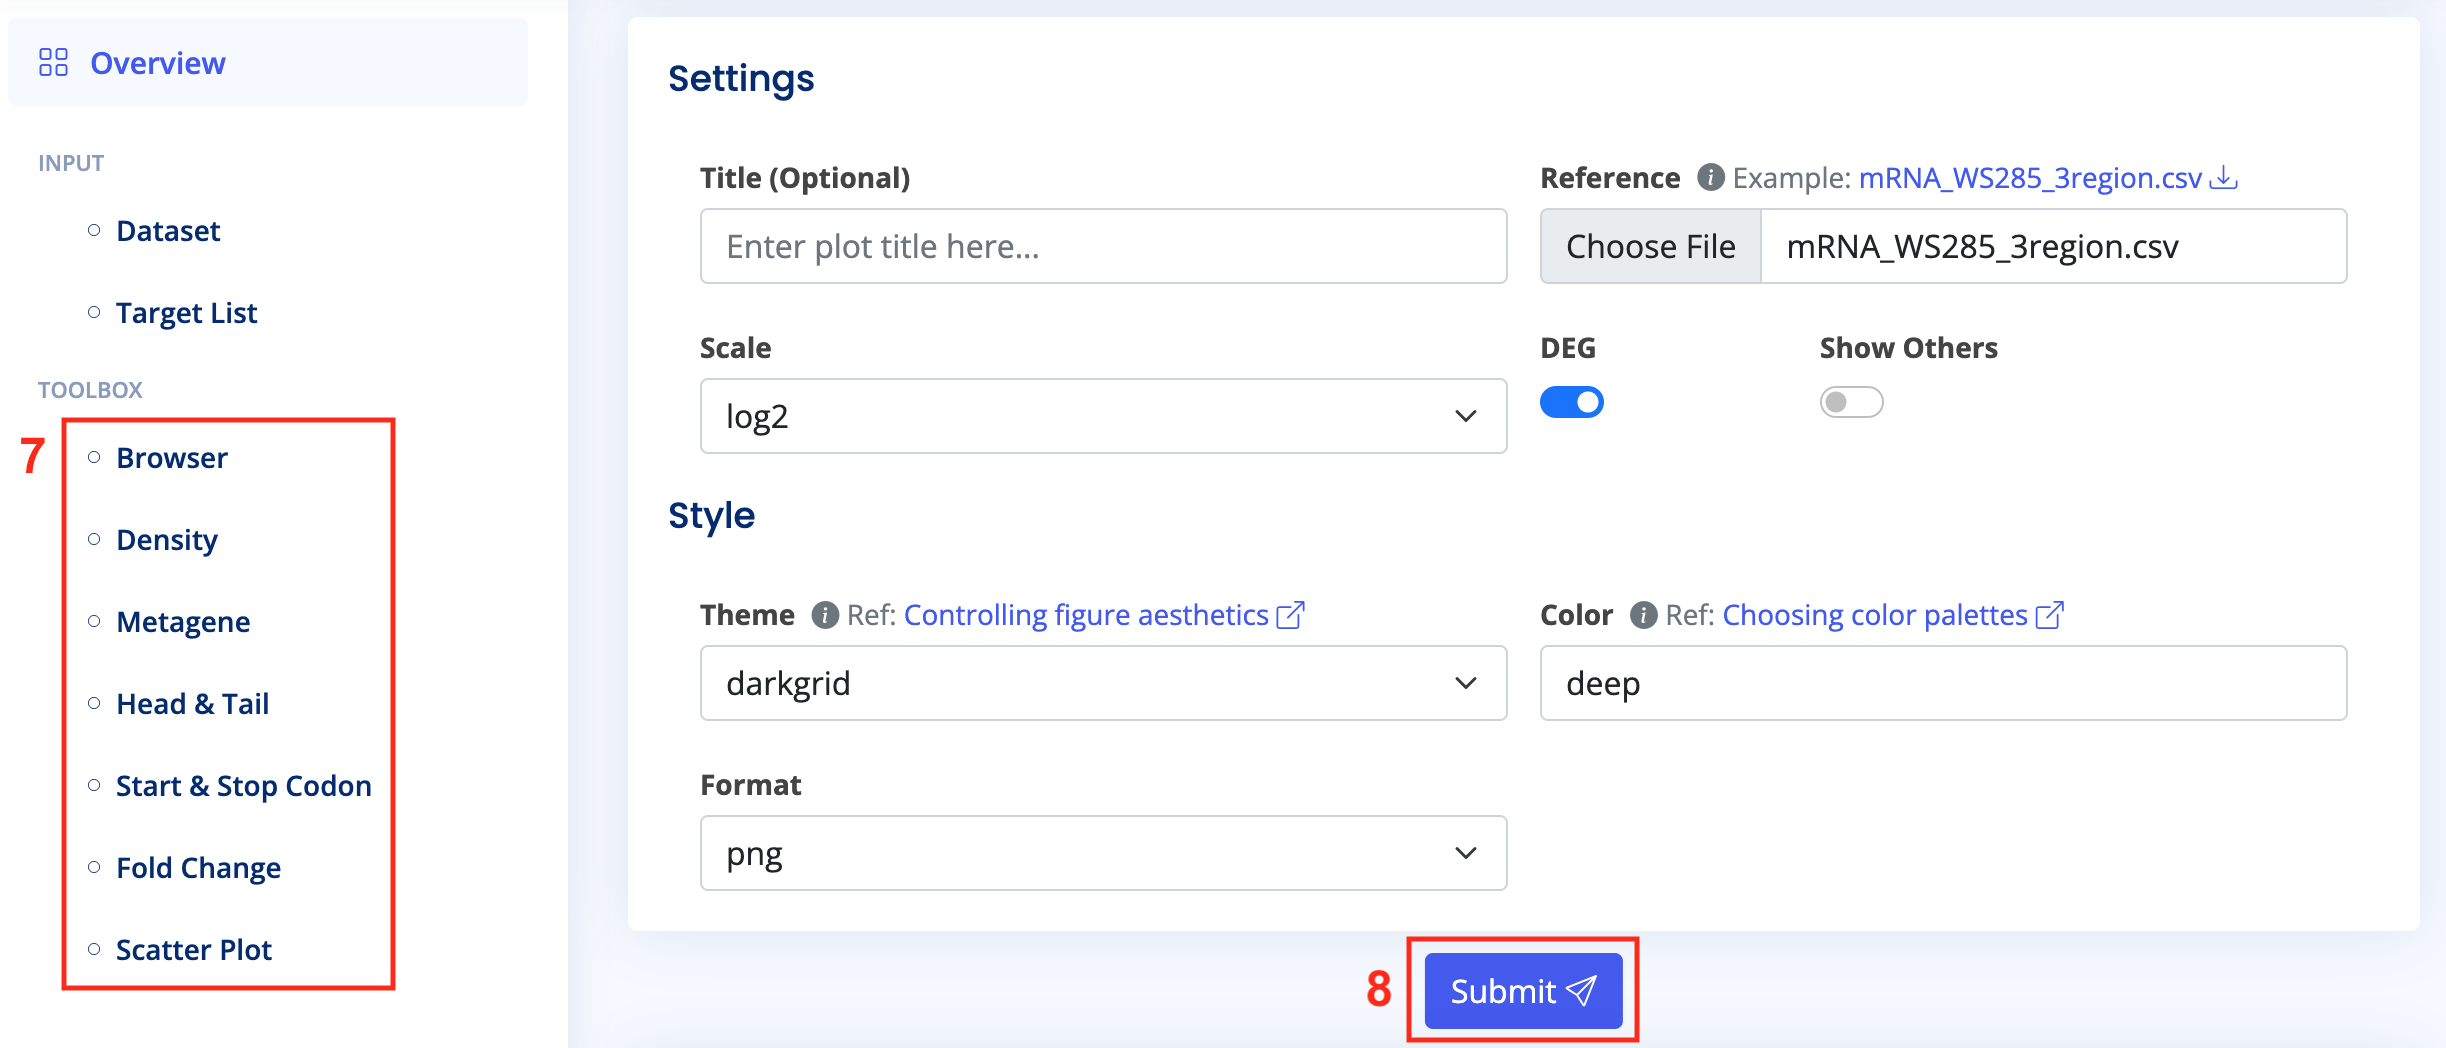
- Click on various tools in the "Toolbox" on the "Analysis Page" and configure them as needed. You may need to upload target RNA references or other files. Once configured, click "Submit" and wait a few minutes until the results appear.
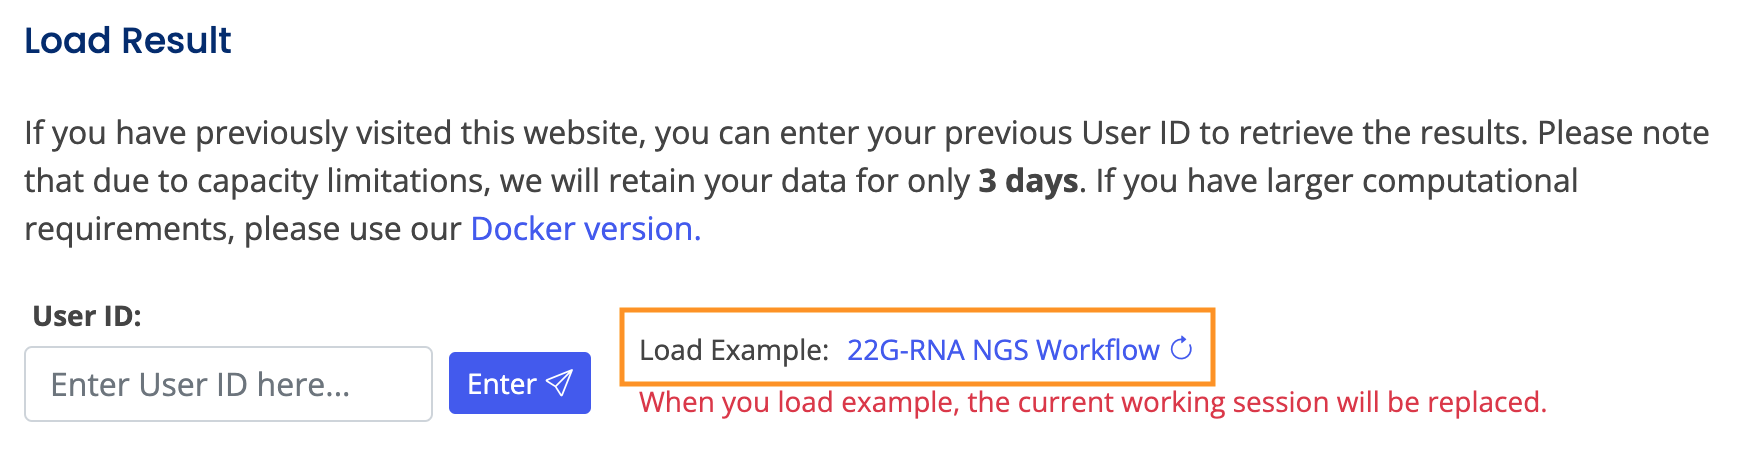
Note: You can load examples to observe results, or download data from the database for personal use. To review the analysis results, you can input the User ID from that session to load all settings and outcomes. All records will be stored on the server for 3 days unless updated.
Preprocess Page
The Preprocess page includes two tools: Workflow and Helper Tool. Workflow facilitates common preprocessing steps for NGS data, including adapter trimming, quality control, length filtering, normalization, and reference alignment. The Helper Tool provides eight data processing functions for individual files, commonly used for tasks such as converting SAM/BAM to CSV files or handling reference files, such as converting ncRNA to miRNA.
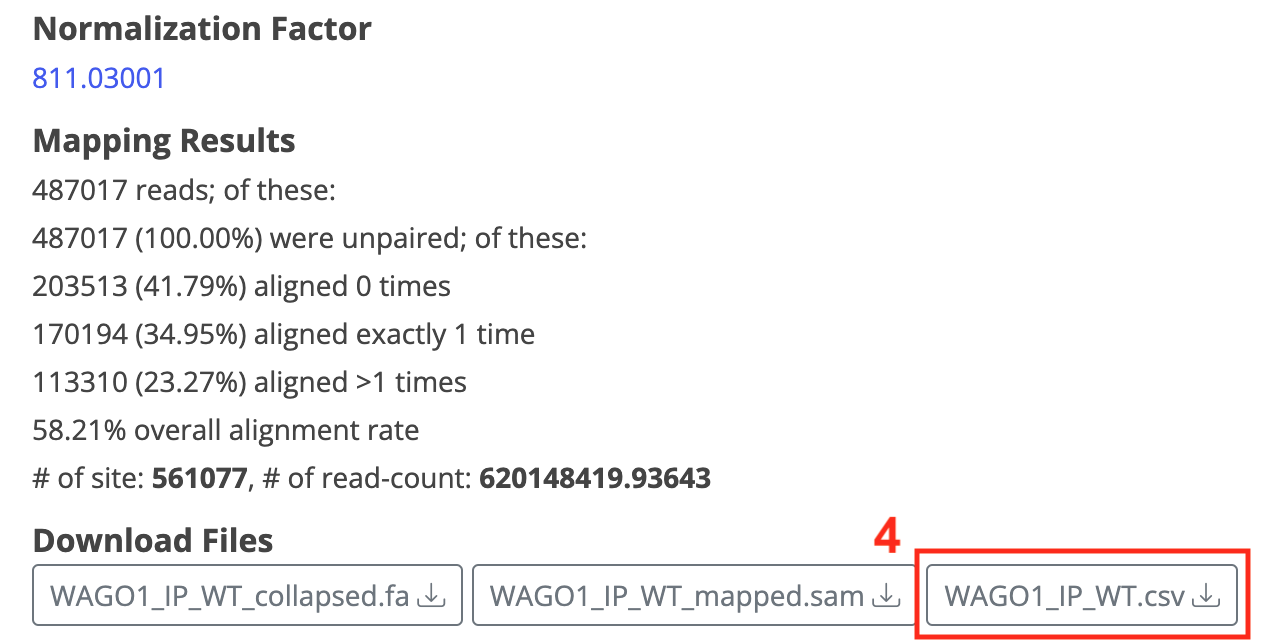
The Workflow output includes:
- Reports before and after FastQC, along with quality box-plots for each position, aiding in assessing whether trimming results meet expectations.
- Normalization Factor
- De-duplicated file [data]_collapse.fa
- Bowtie2 alignment results, including alignment ratios, site and read-count quantities, and [data]_mapped.sam
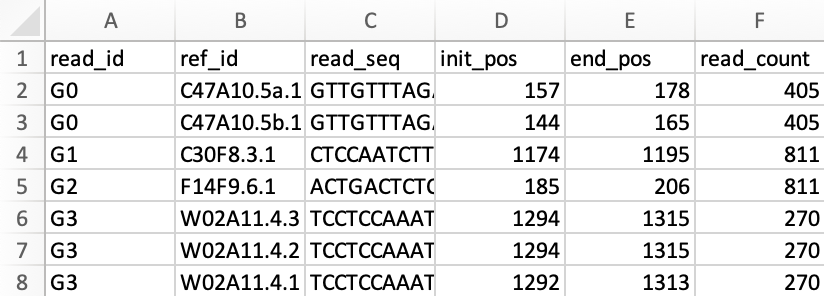
- Organized alignment results [data].csv, suitable as dataset for downstream analysis
The Helper Tool includes functions such as file conversion, ID tag detection, nucleotide conversion, reverse complement, head/tail or length filtering, collapsing, read-count distribution or normalization, and column merging from different files. Processed files will have the suffix "_preprocess" appended to the filename.
For detailed usage instructions, hover over the tool options or refer to examples.
Analysis Page
The Analysis page includes seven analytical functionalities, requiring users to specify the Dataset and the Target List of interest to activate them.
-
Browser: Visualizes read-reference alignment results, with users providing a target RNA reference for
comparison. Users can further define specific regions of interest (e.g., UTR, CDS, exon, intron). Analysis
results include table view and graphical view, allowing for detailed examination of small RNA binding sites,
read-count distribution, and alignment details on specific target RNAs.
-
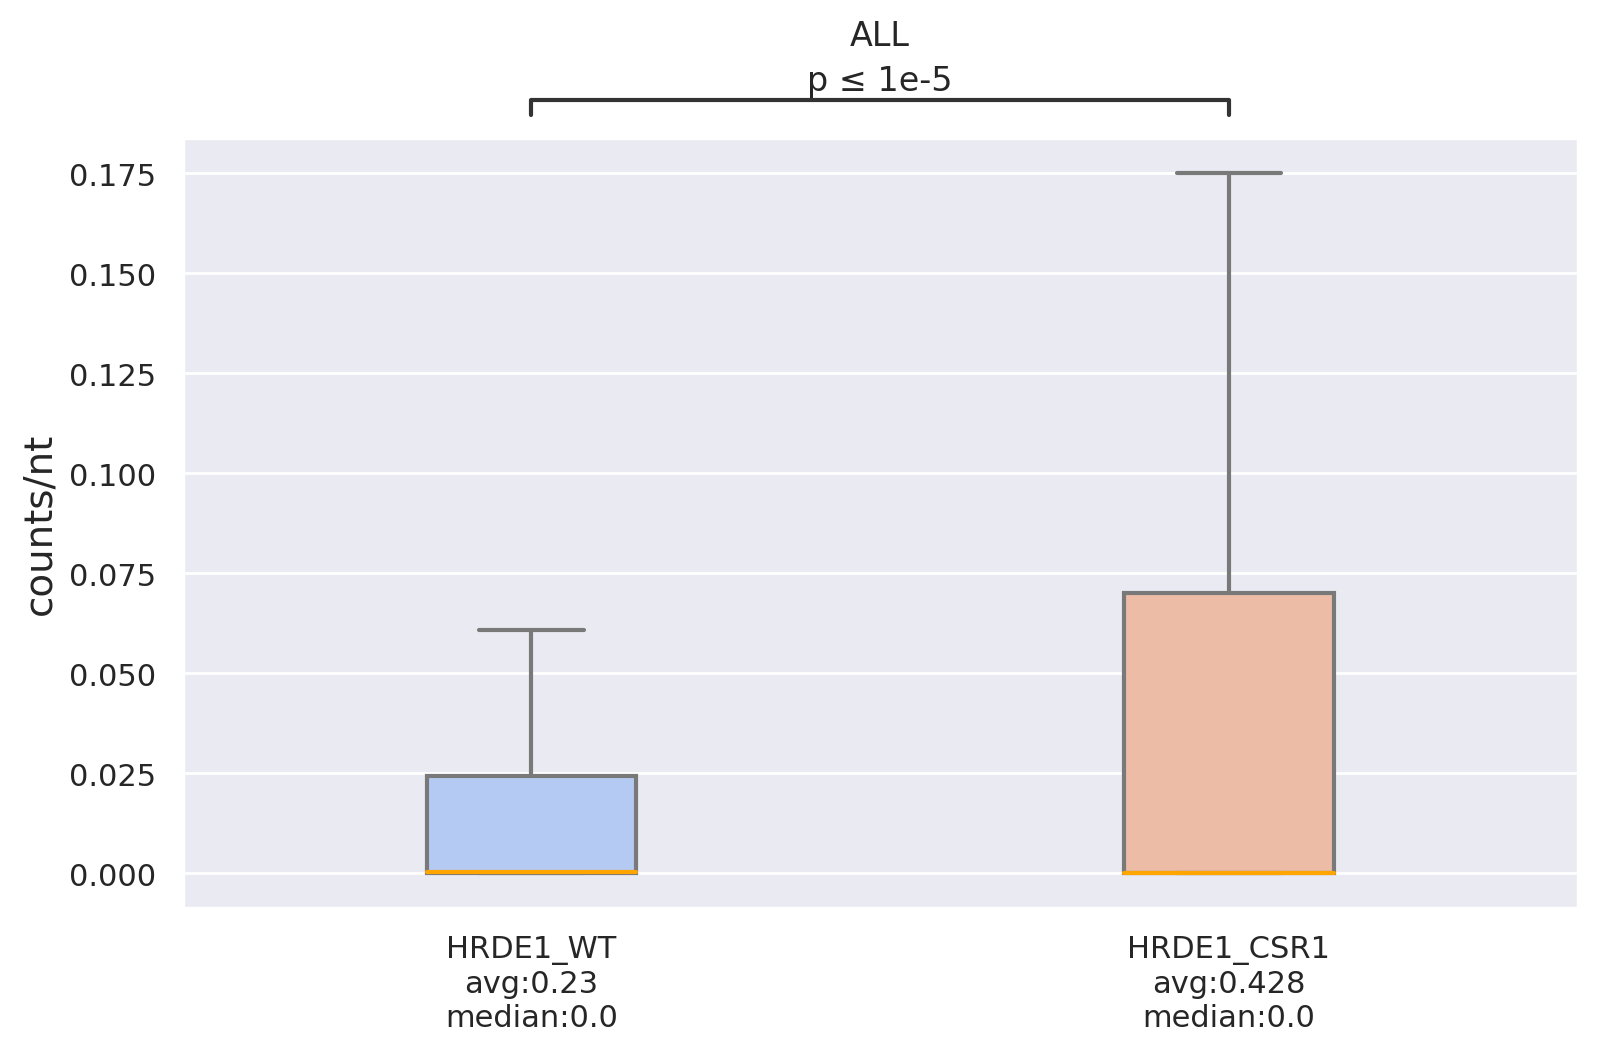
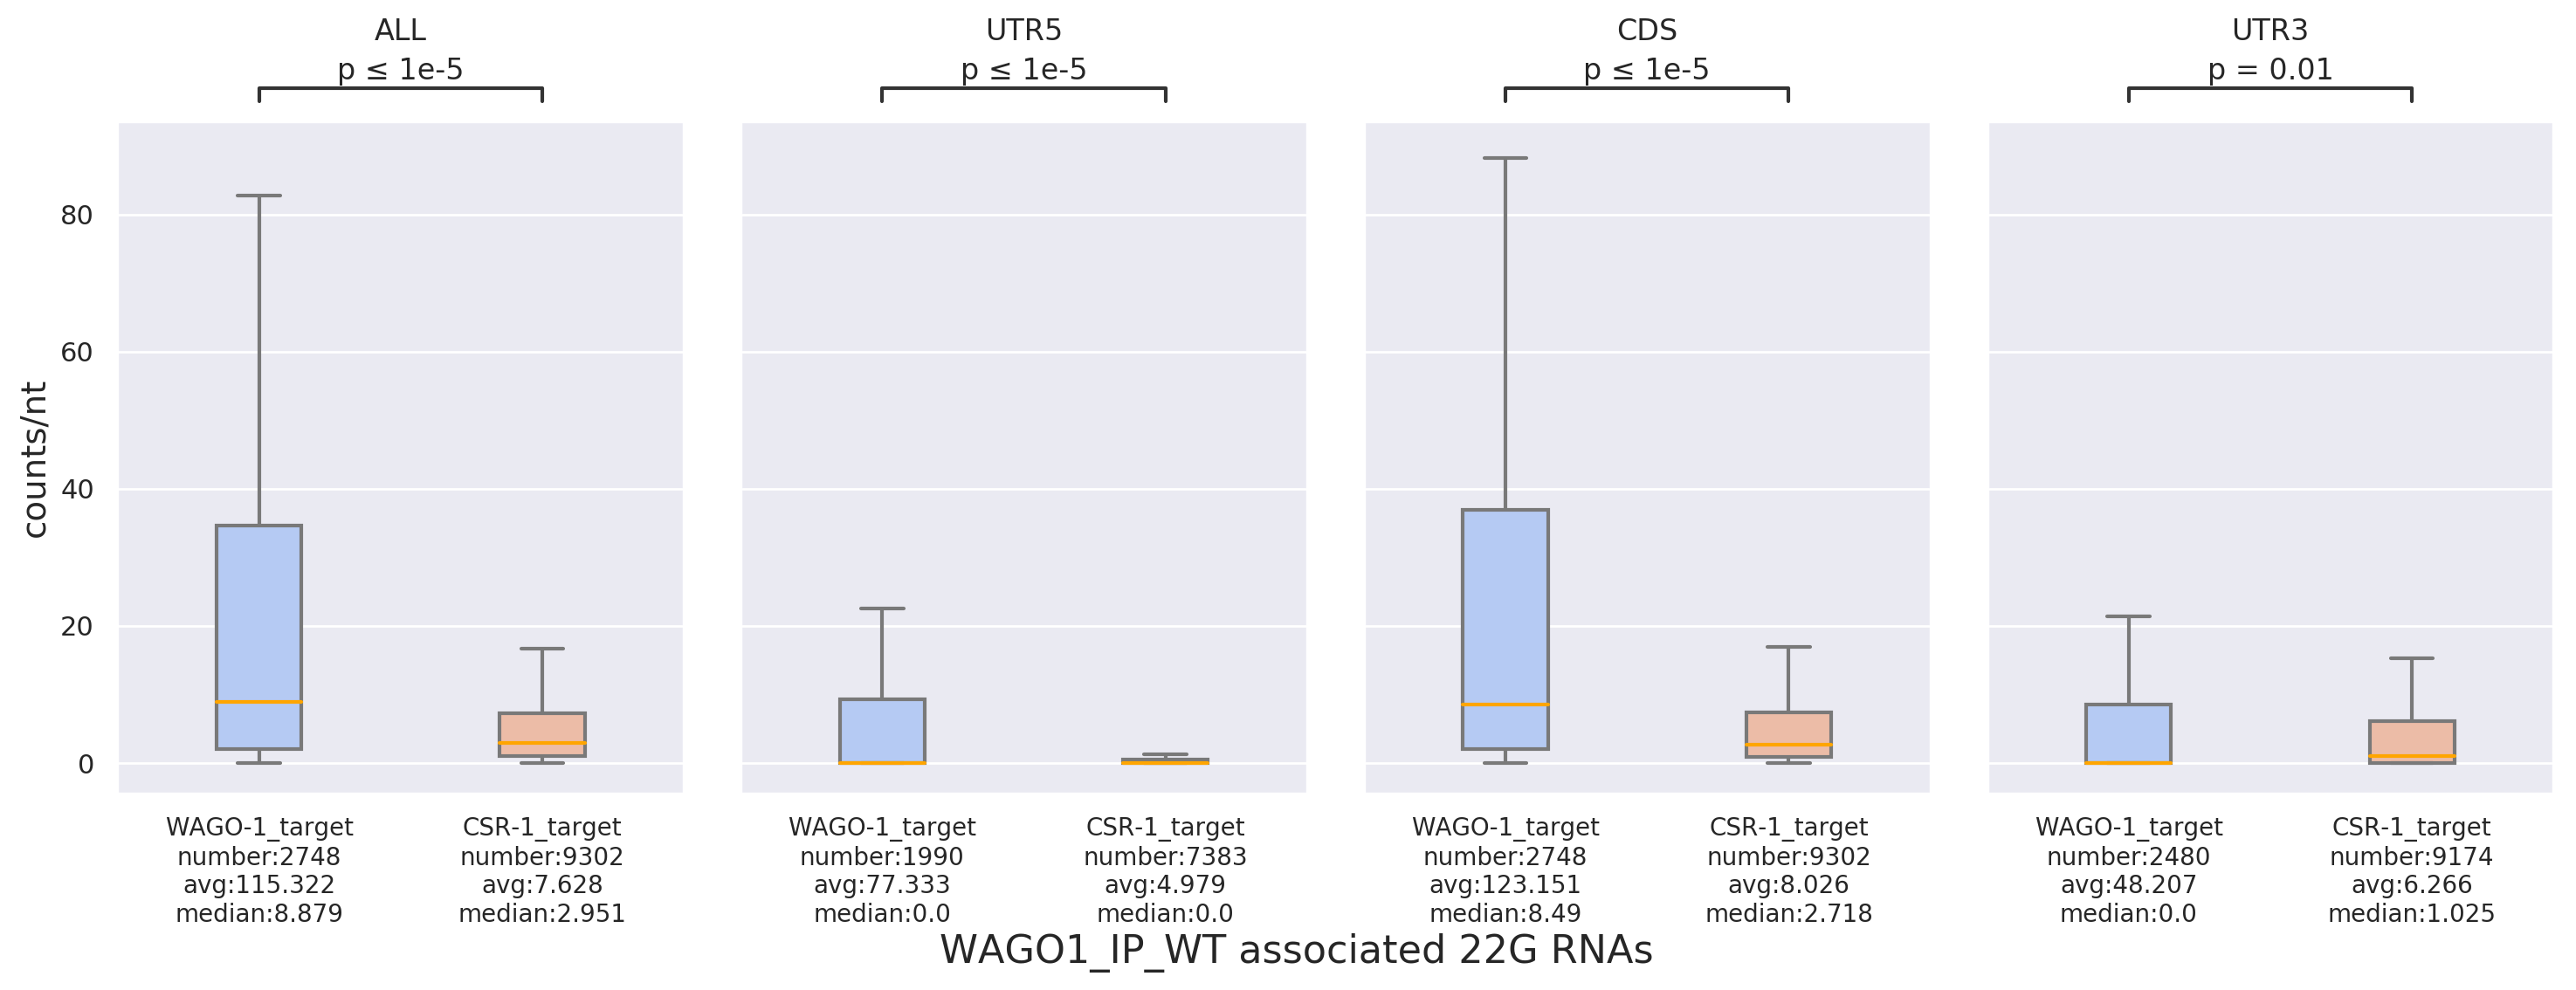
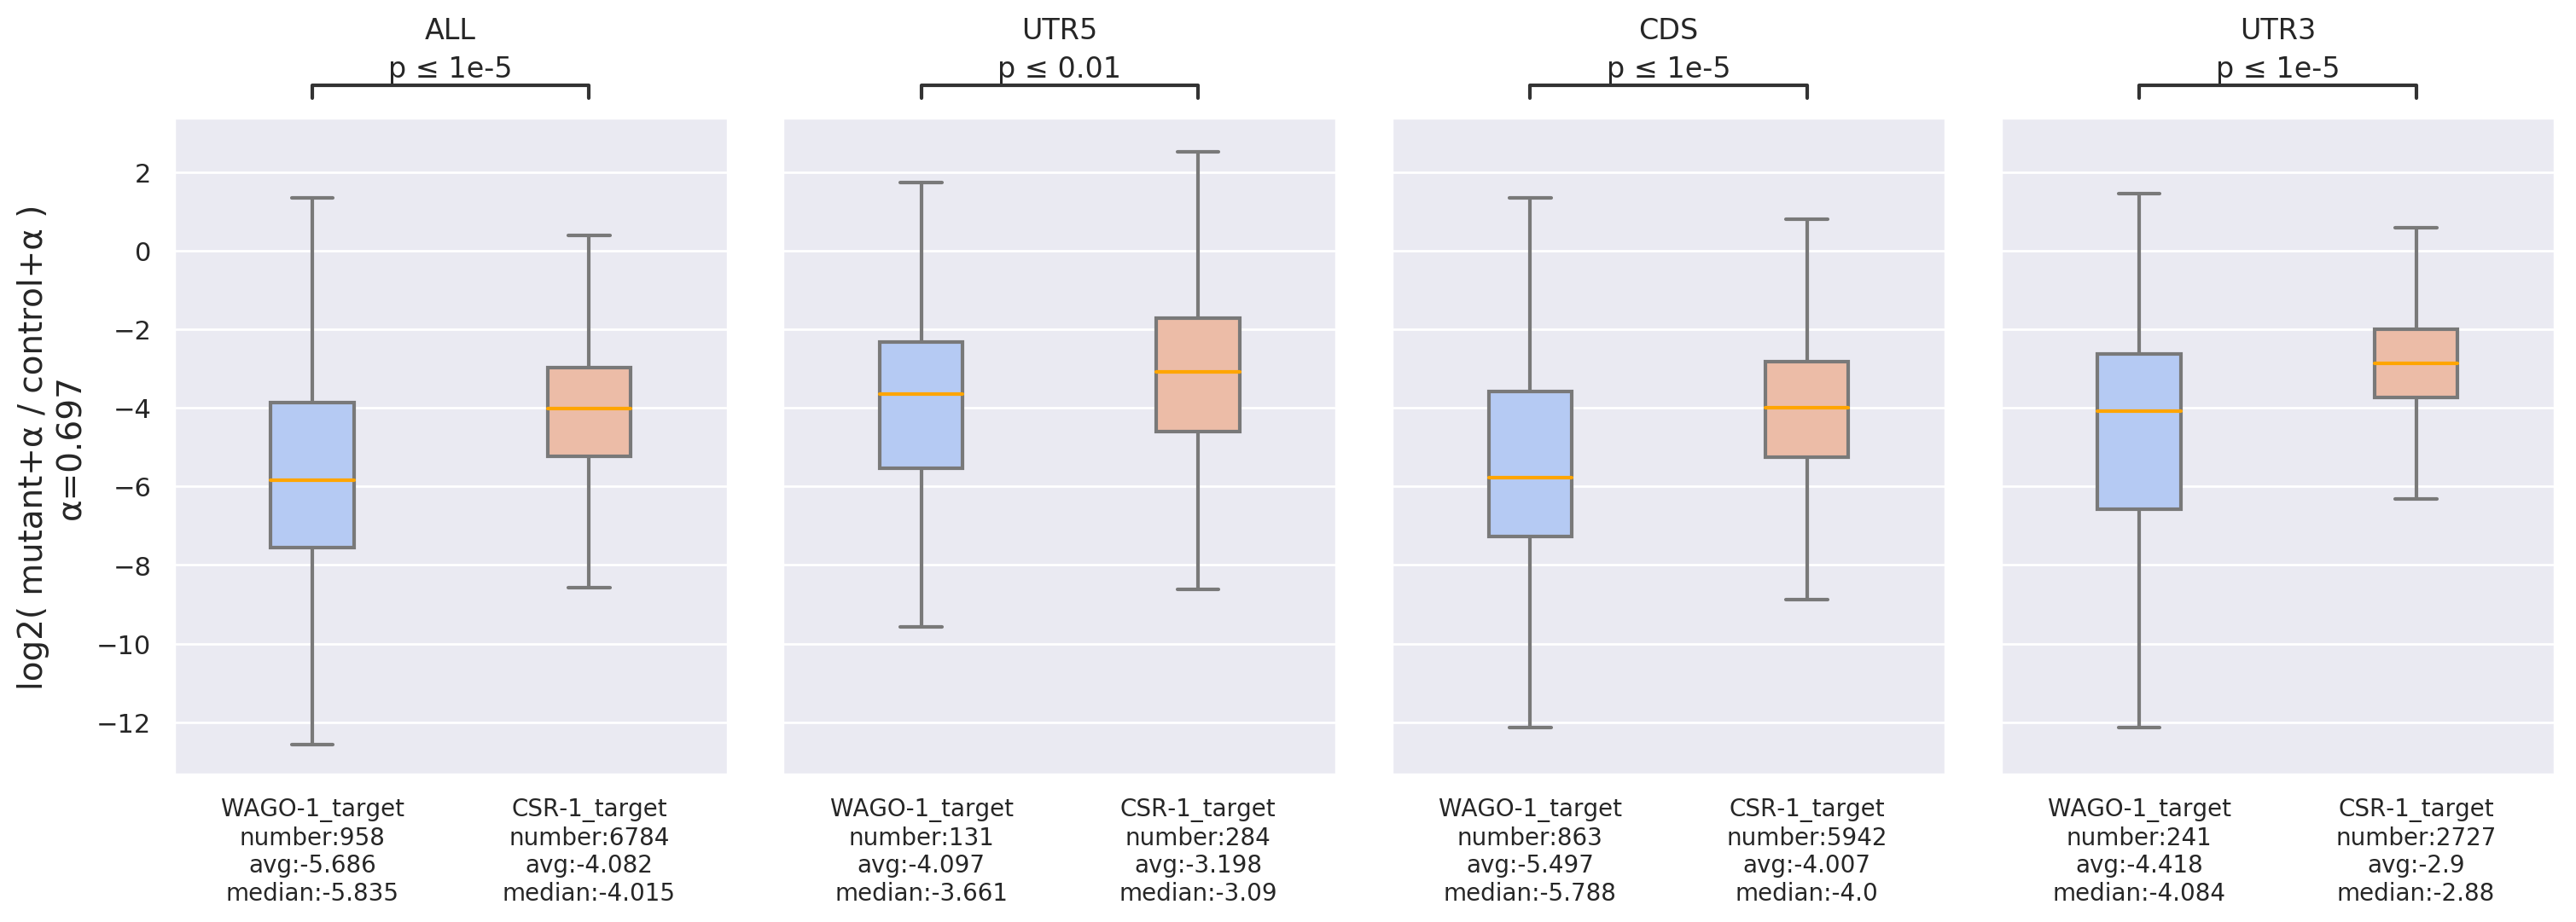
Density: Compares read-count density among different datasets, target lists, or regions (e.g., 5'UTR,
CDS,
3'UTR) using box plots. This is useful for observing binding trends of small RNAs across different targets,
supplemented with statistical tests (including T-test and U-test).
-
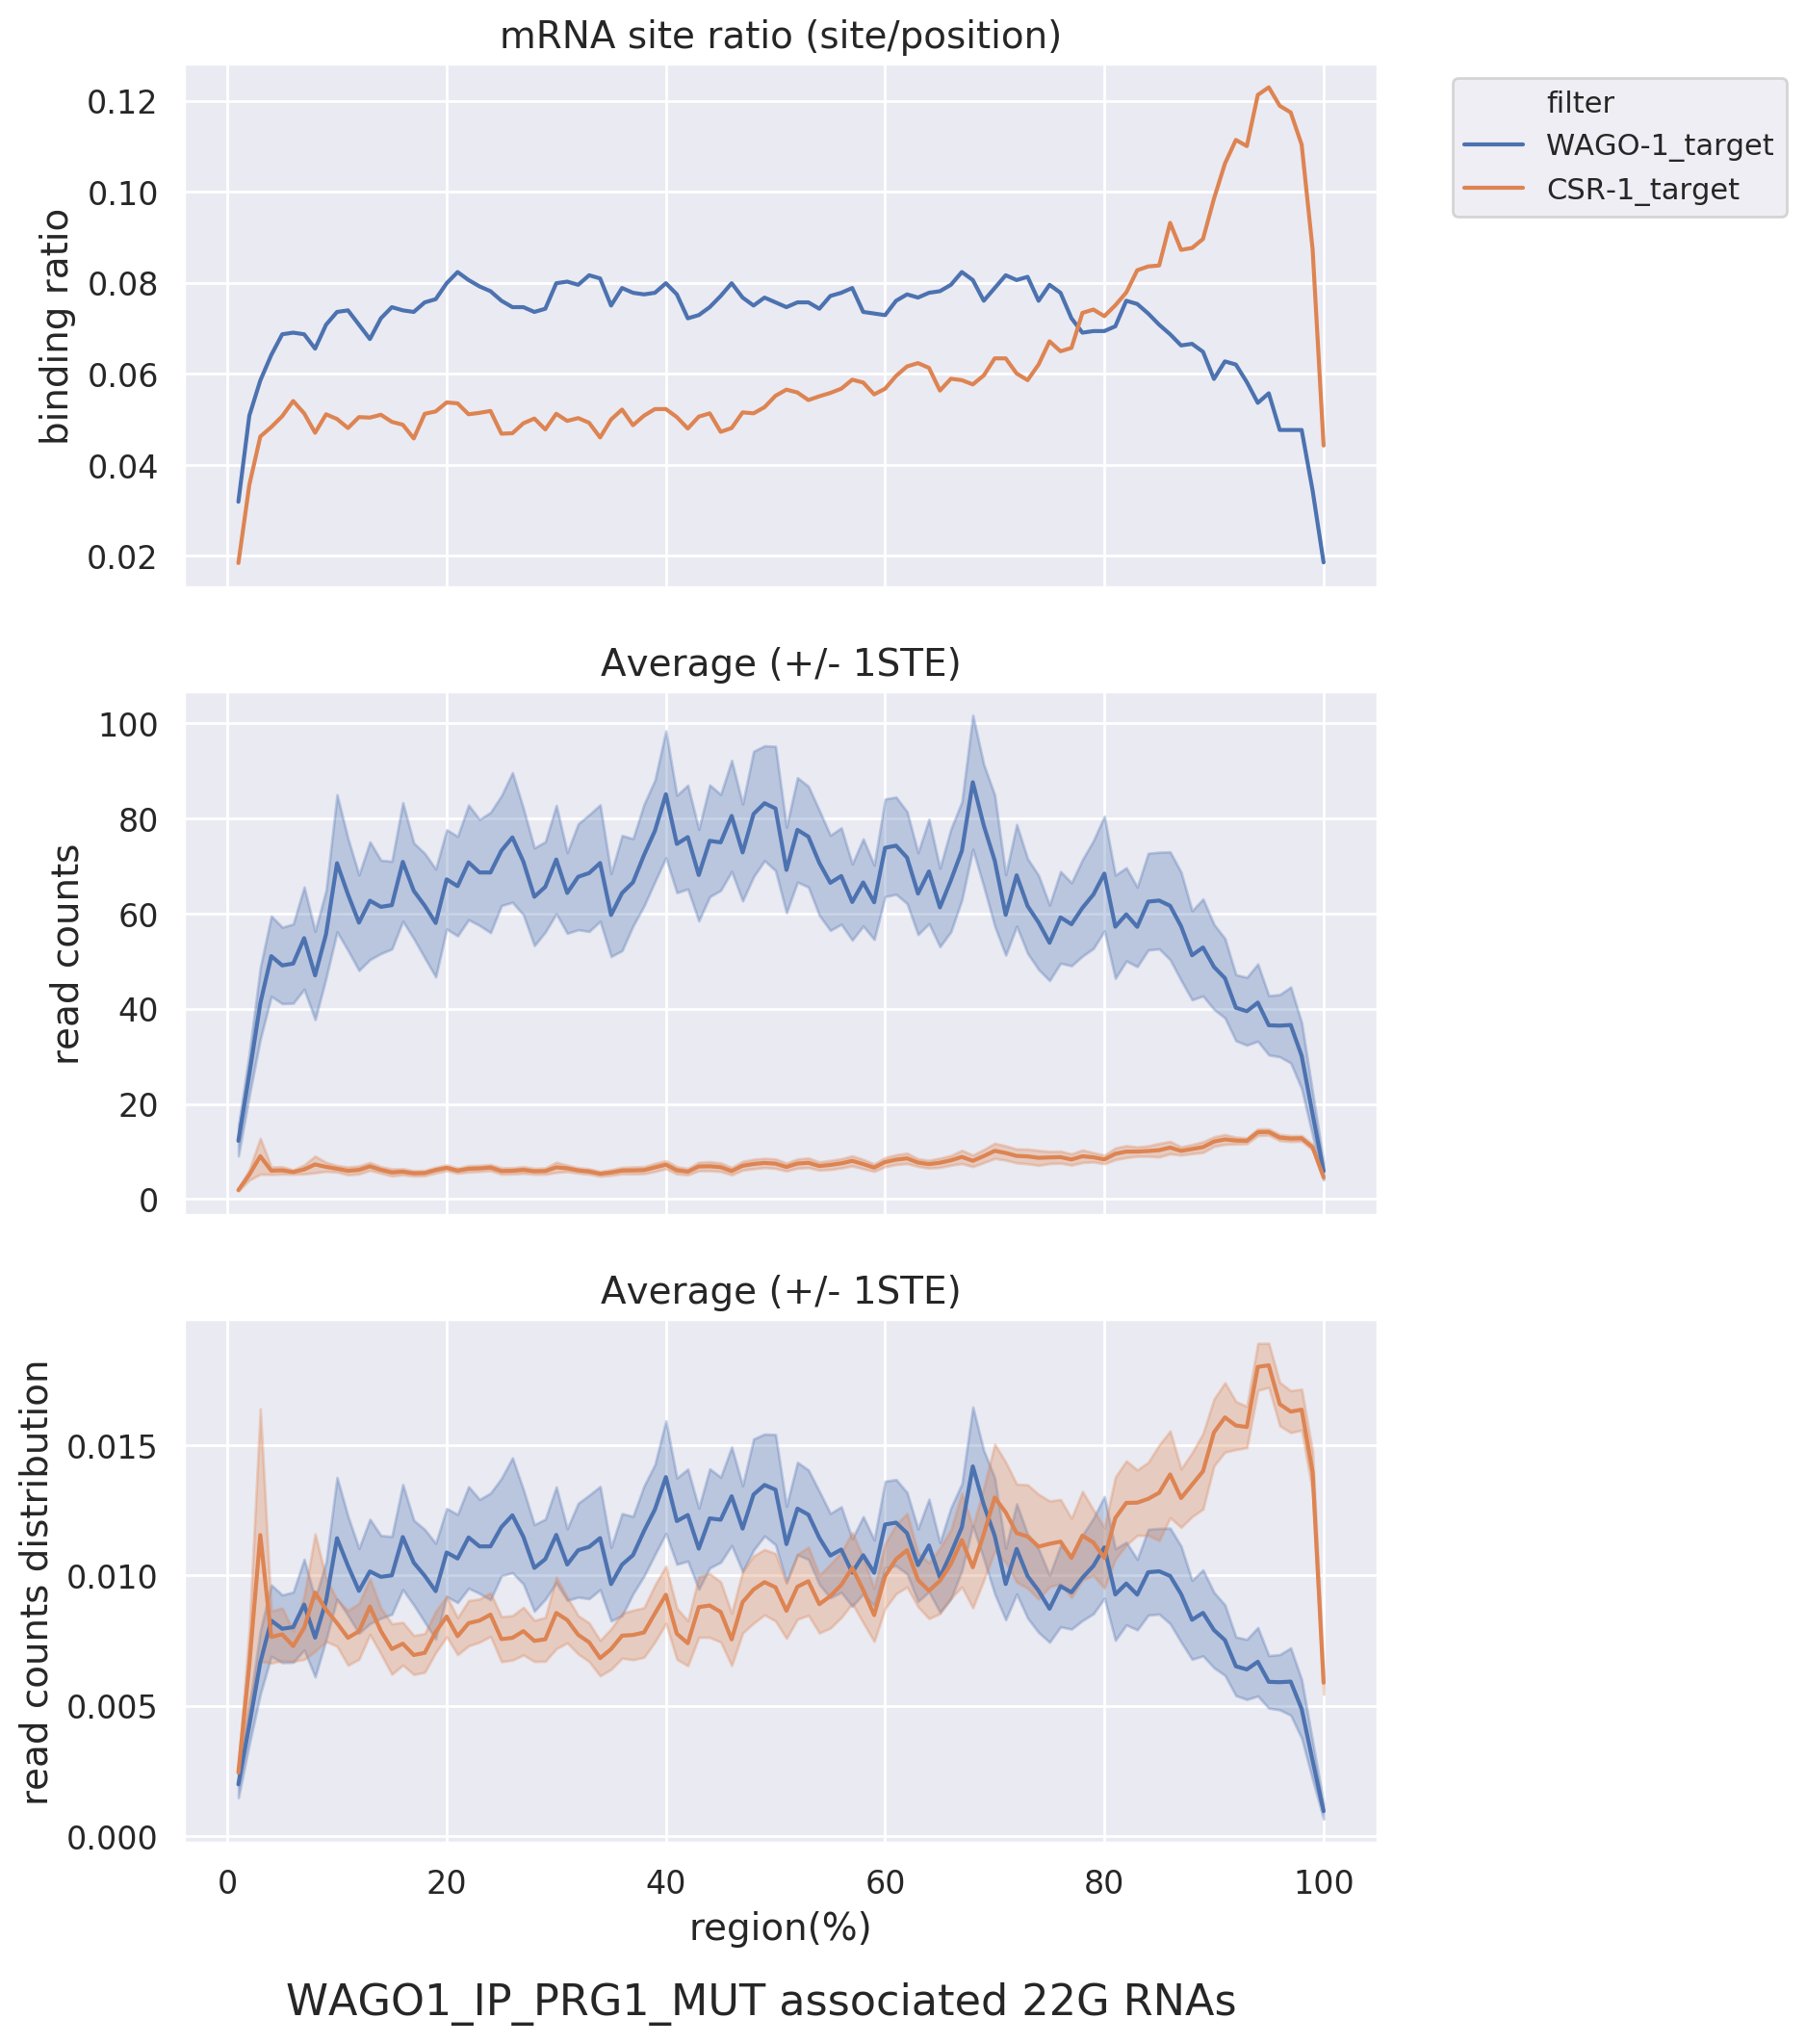
Metagene: Presents overall binding trends in different datasets and target lists via line graphs.
Dividing the
target RNA into 100%, this visualization observes the distribution of sRNA read-counts and binding ratios.
For
example, it can assess whether CSR-1 targets preferentially bind near the 3' end compared to WAGO targets in
PRG-1 mutant.
-
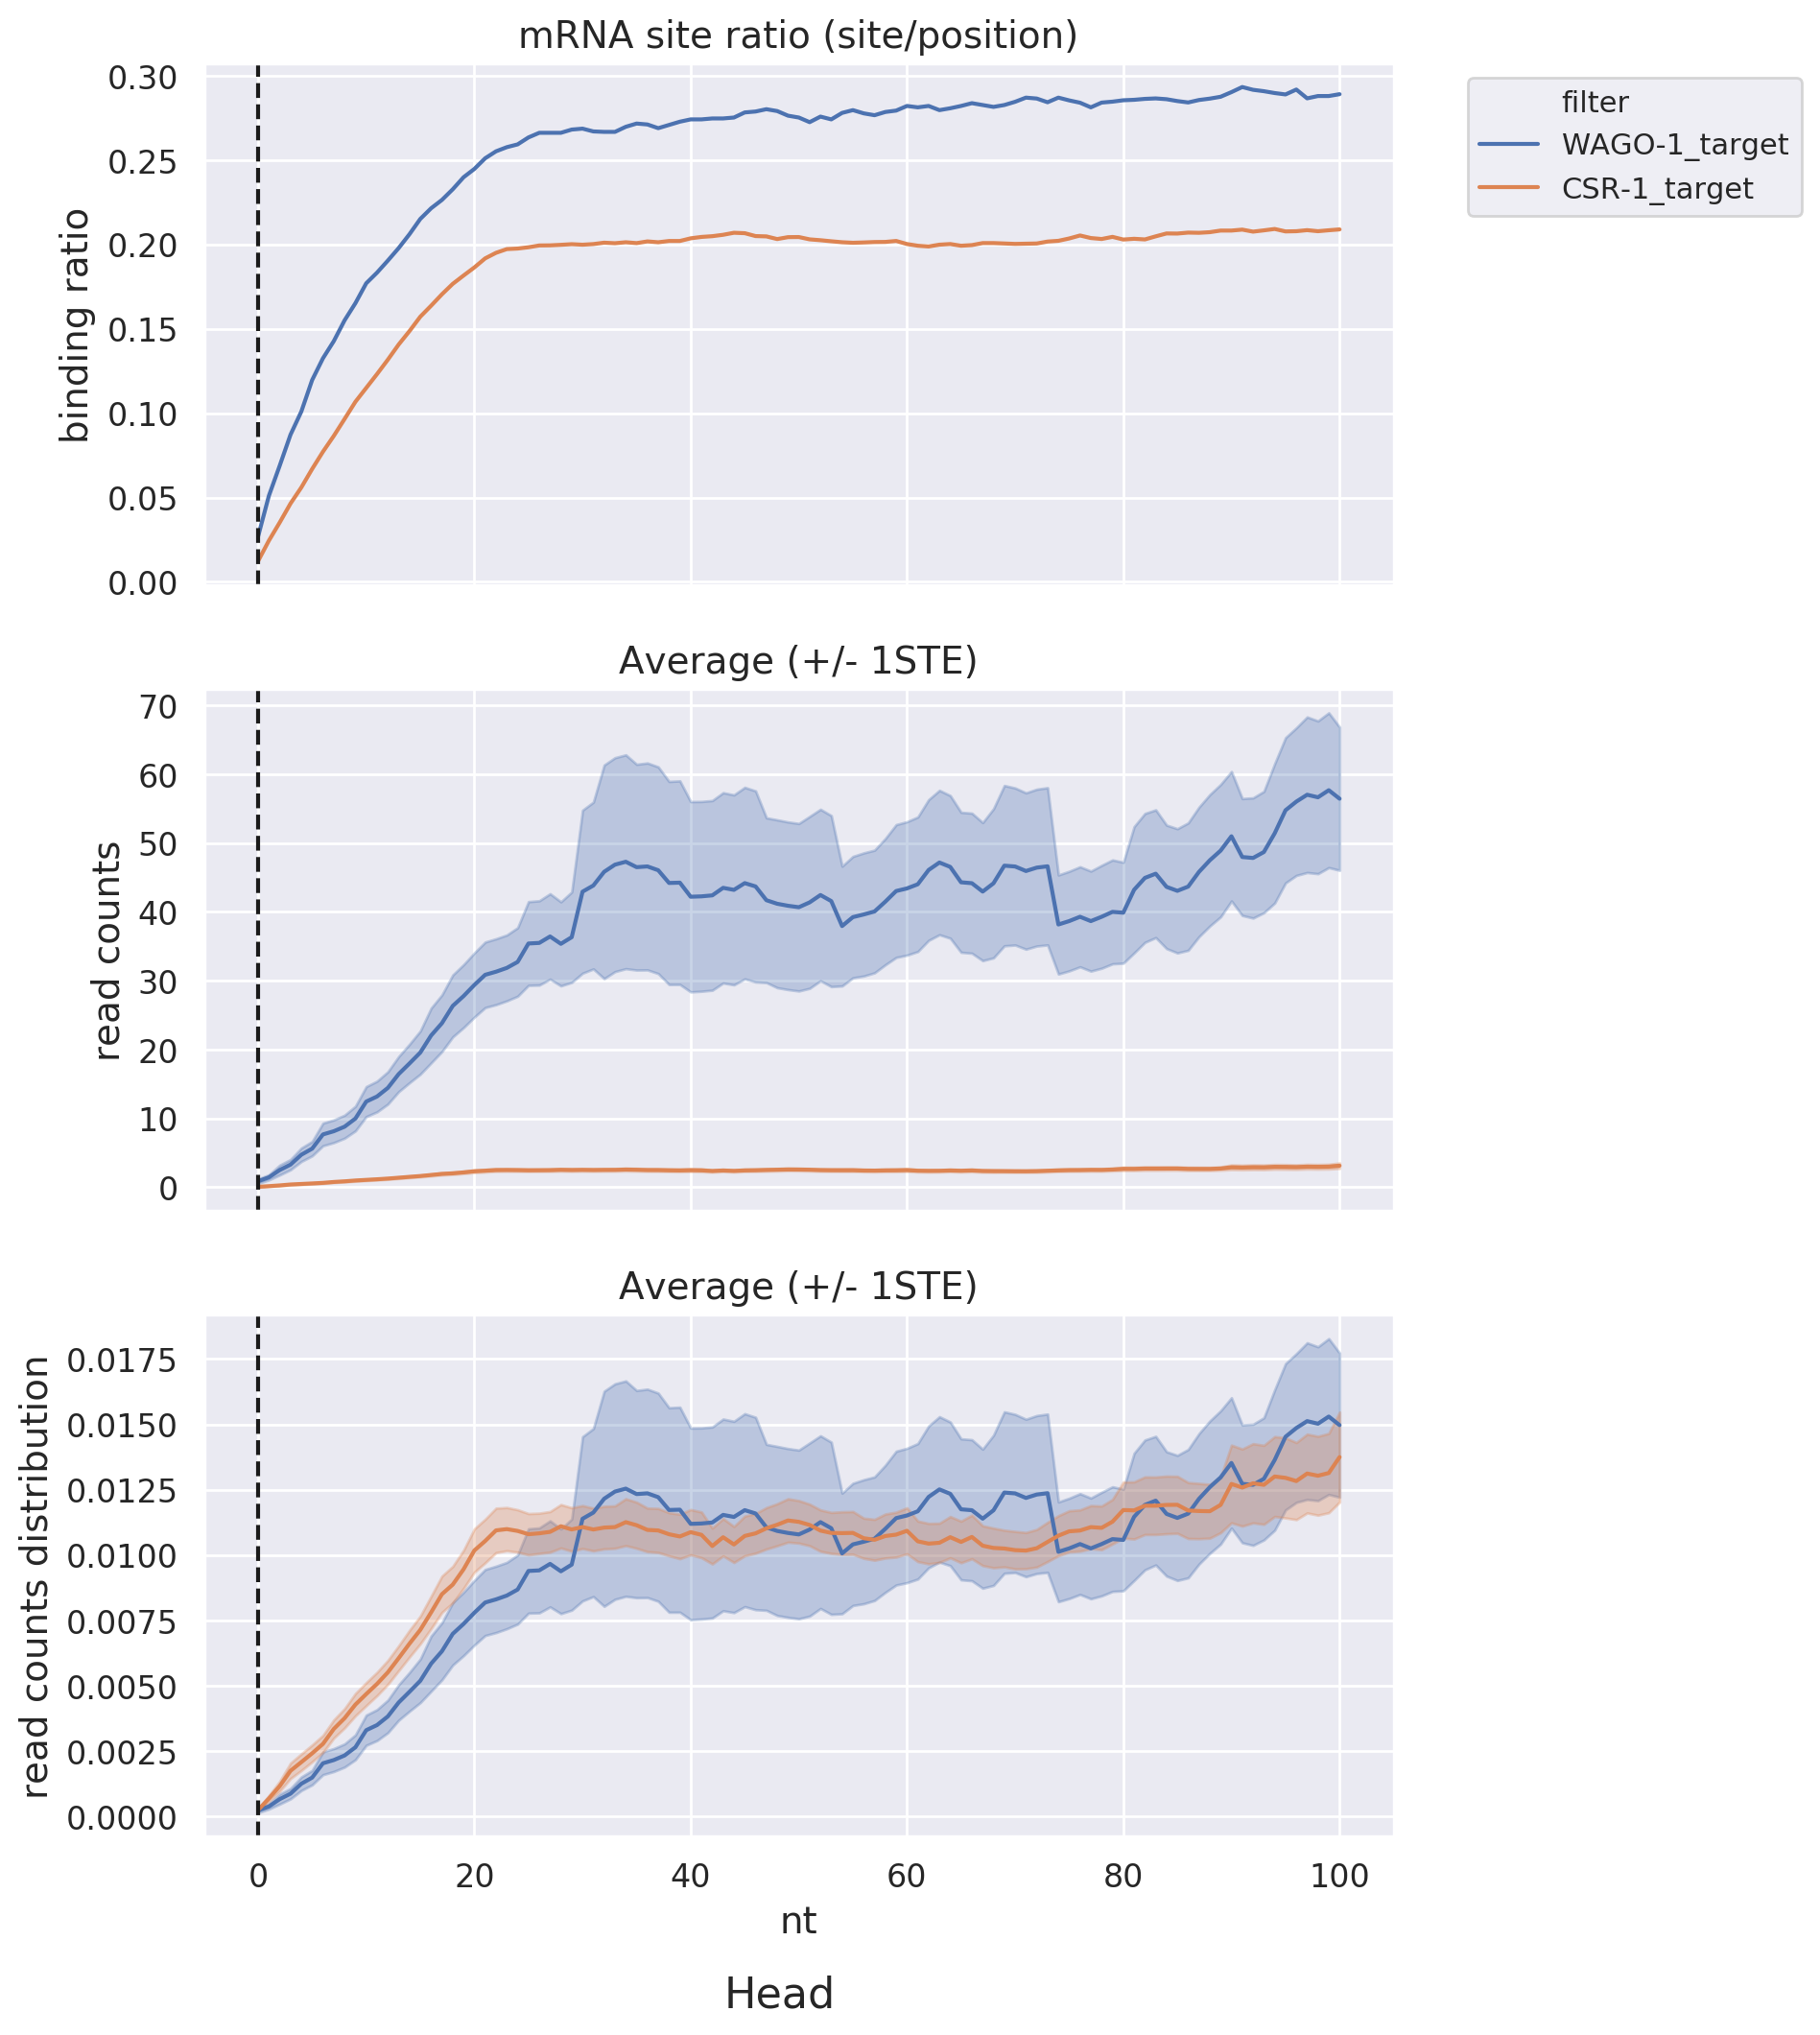
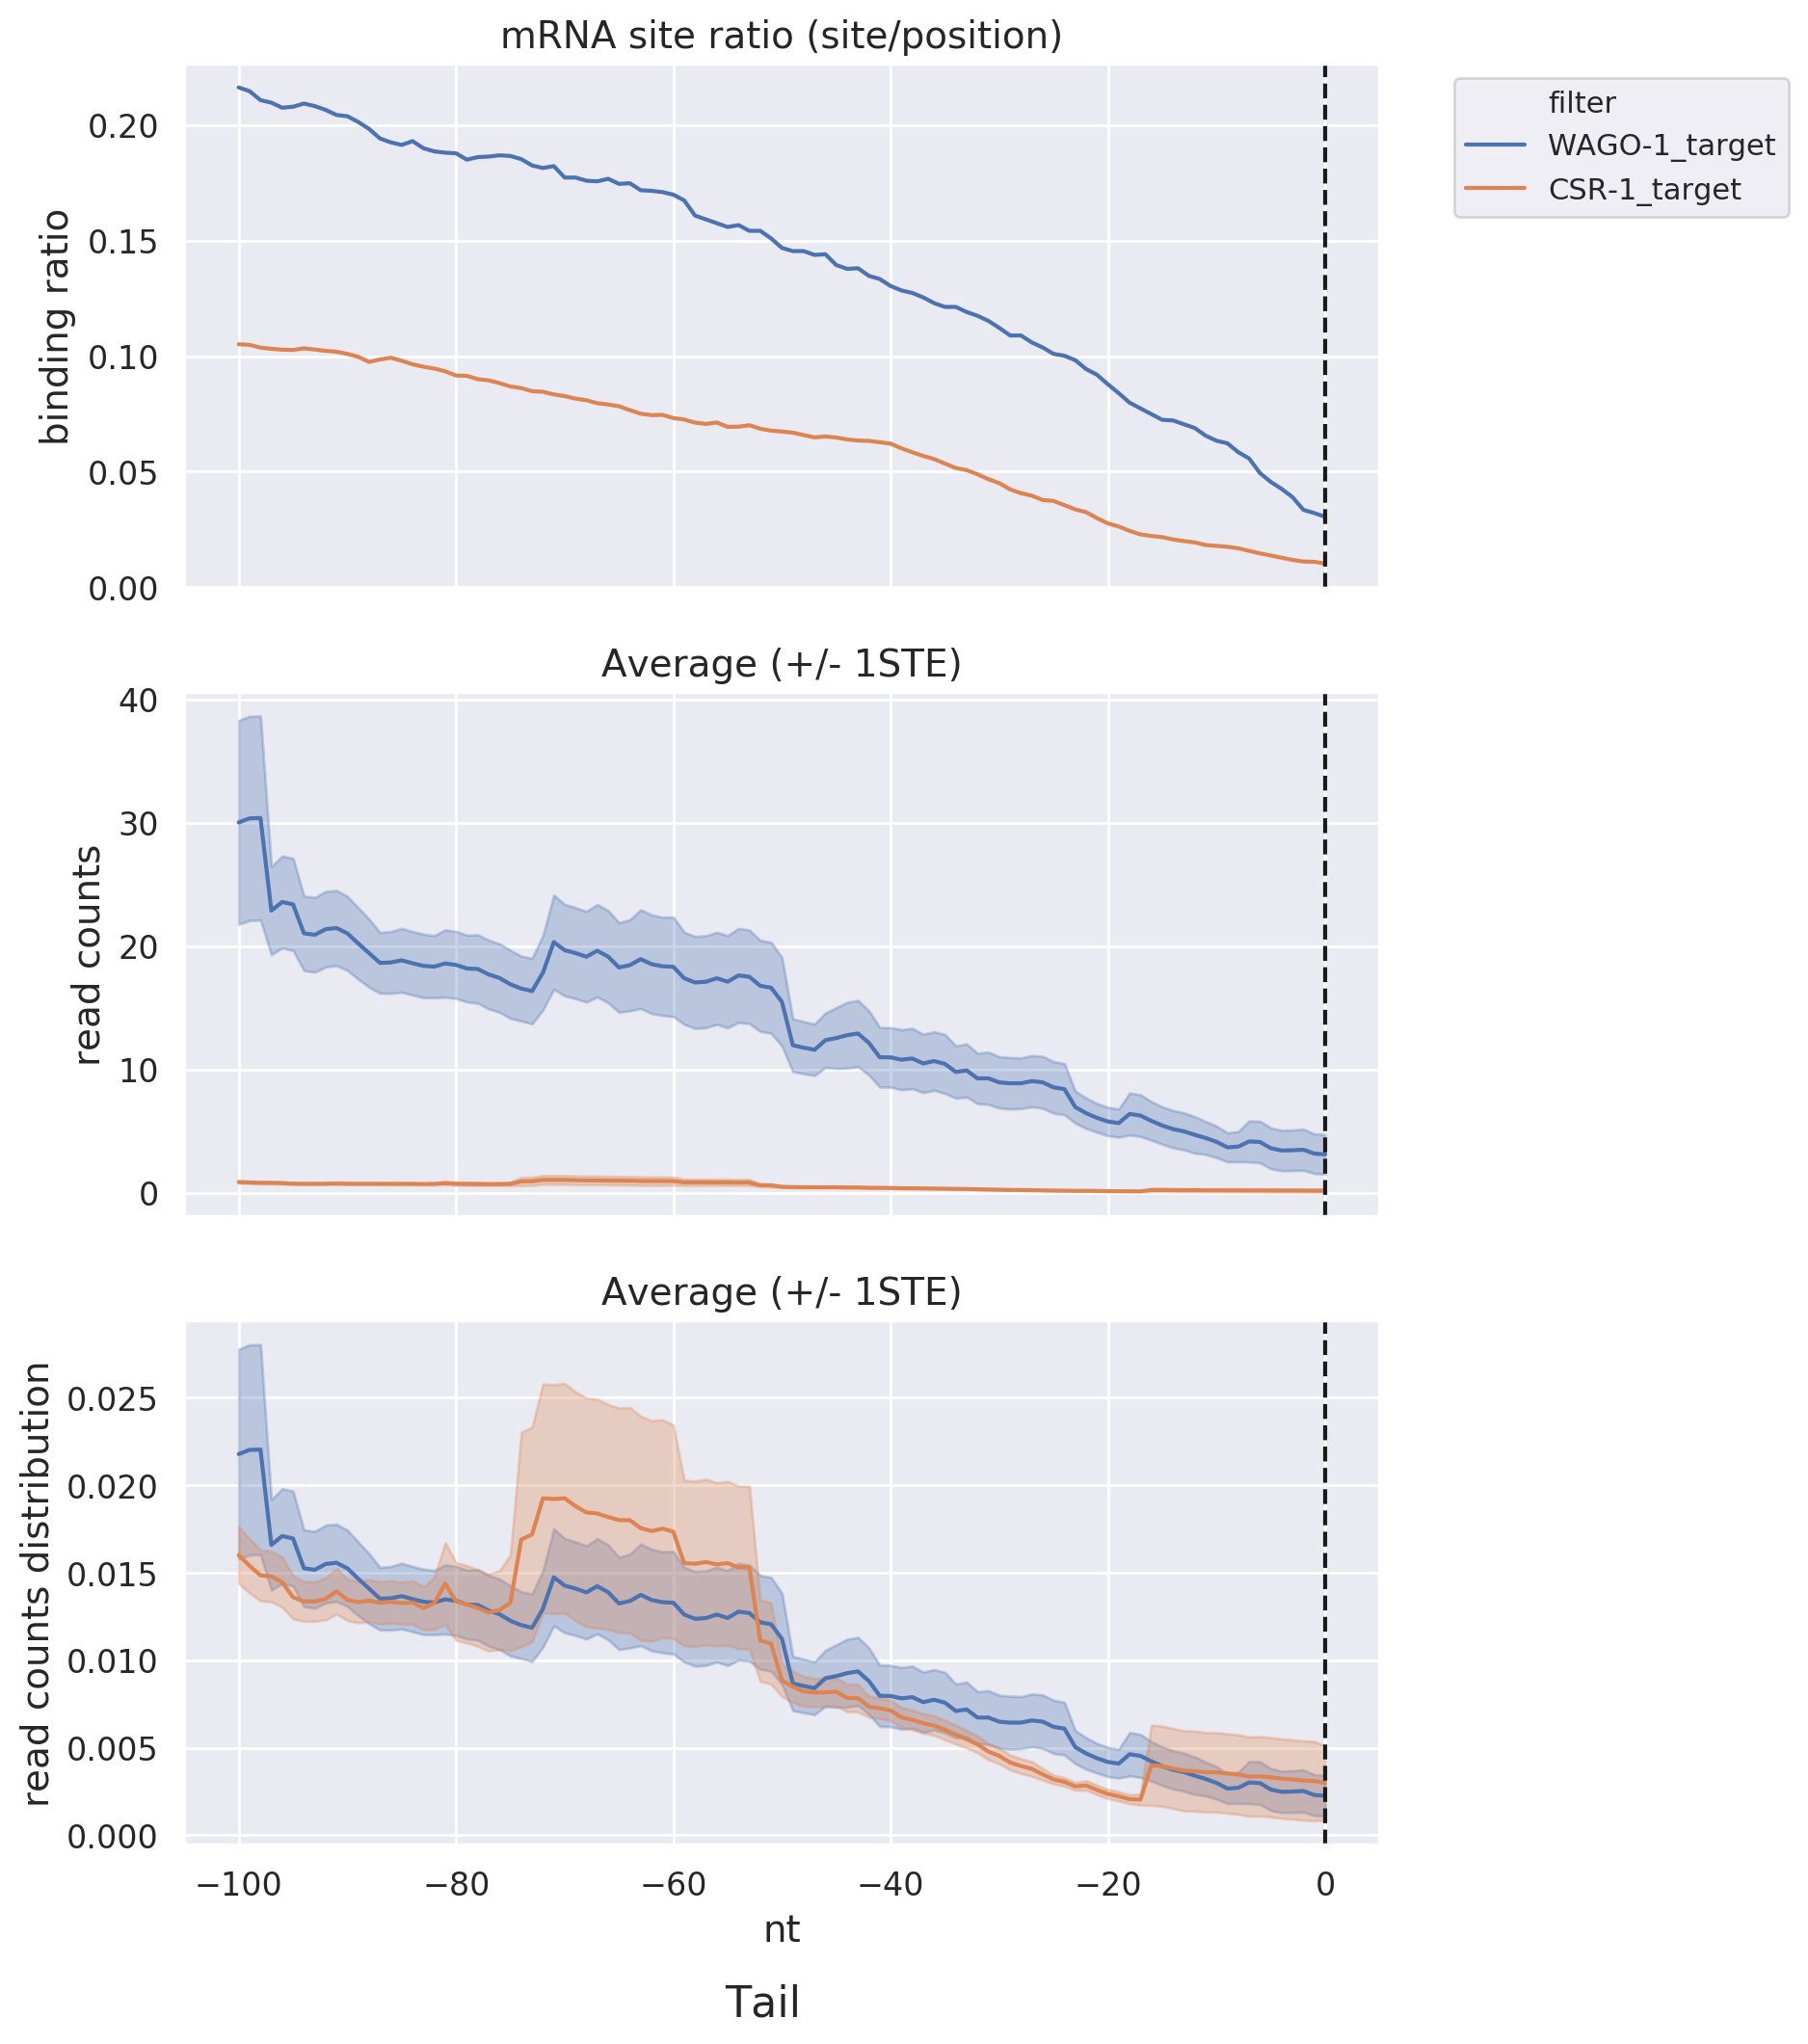
Head & Tail: Displays read-count distribution near the head and tail within a specific distance via
line
graphs, allowing for comparisons among different datasets or target lists.
-
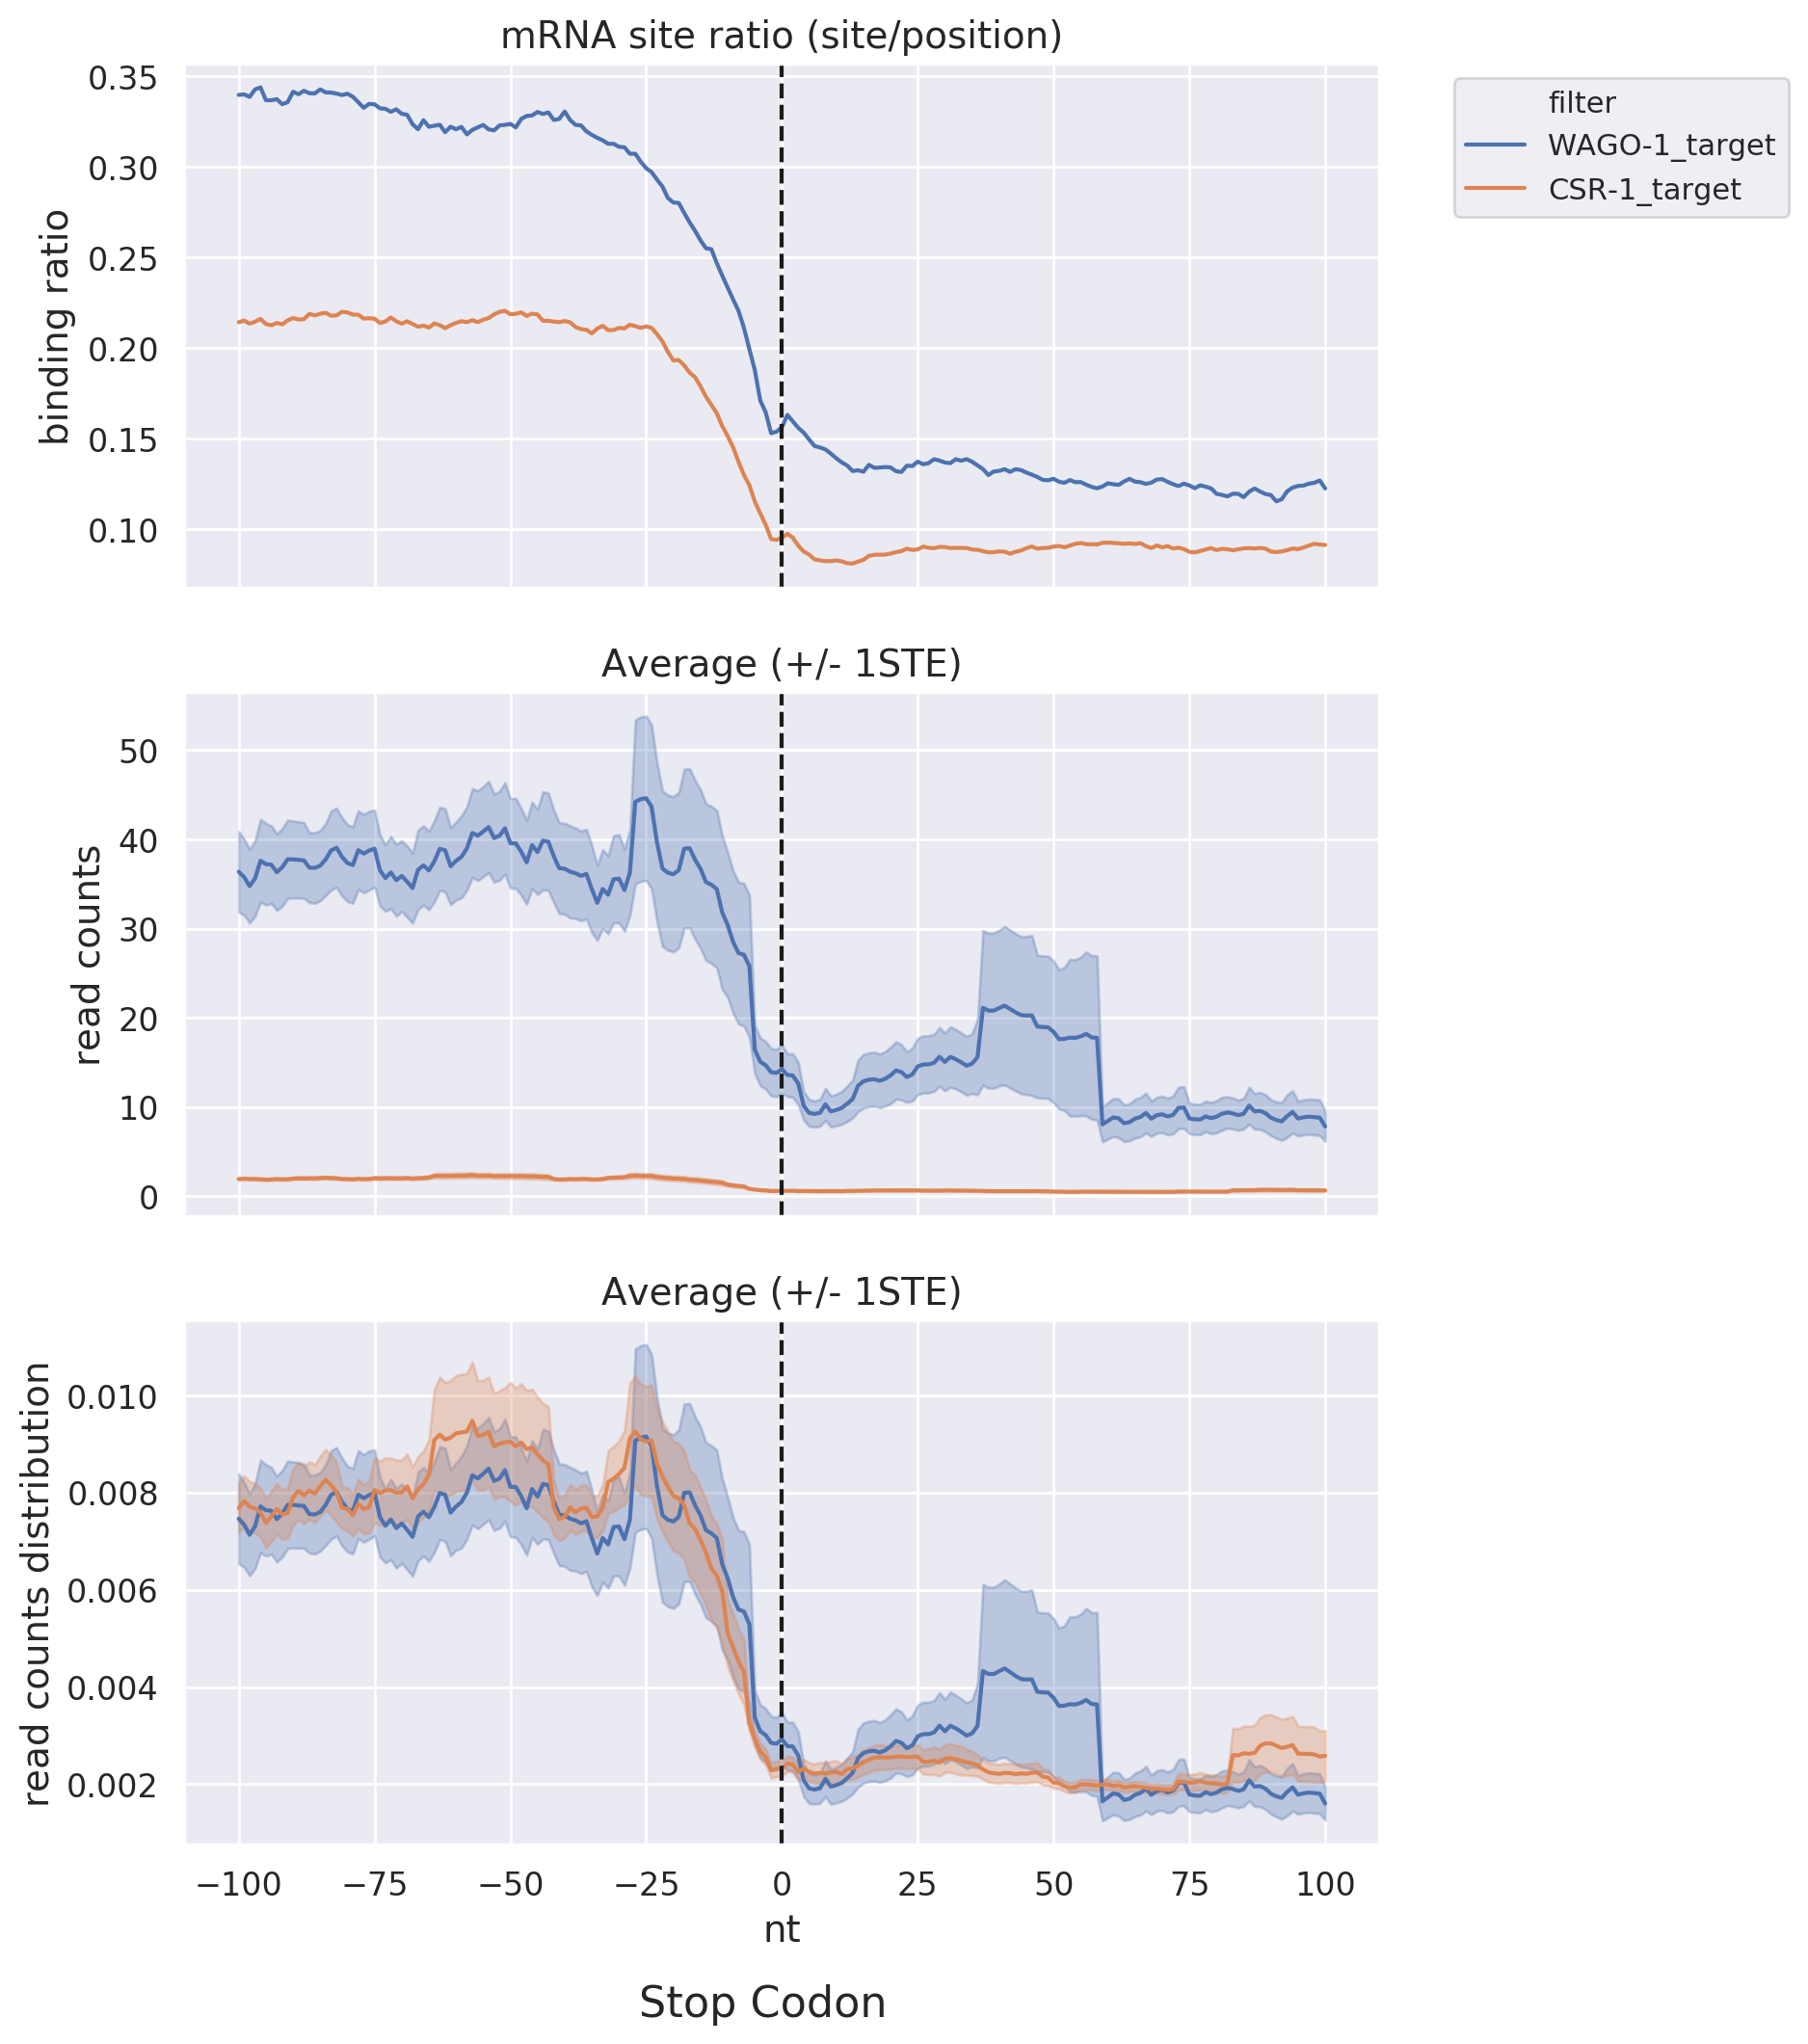
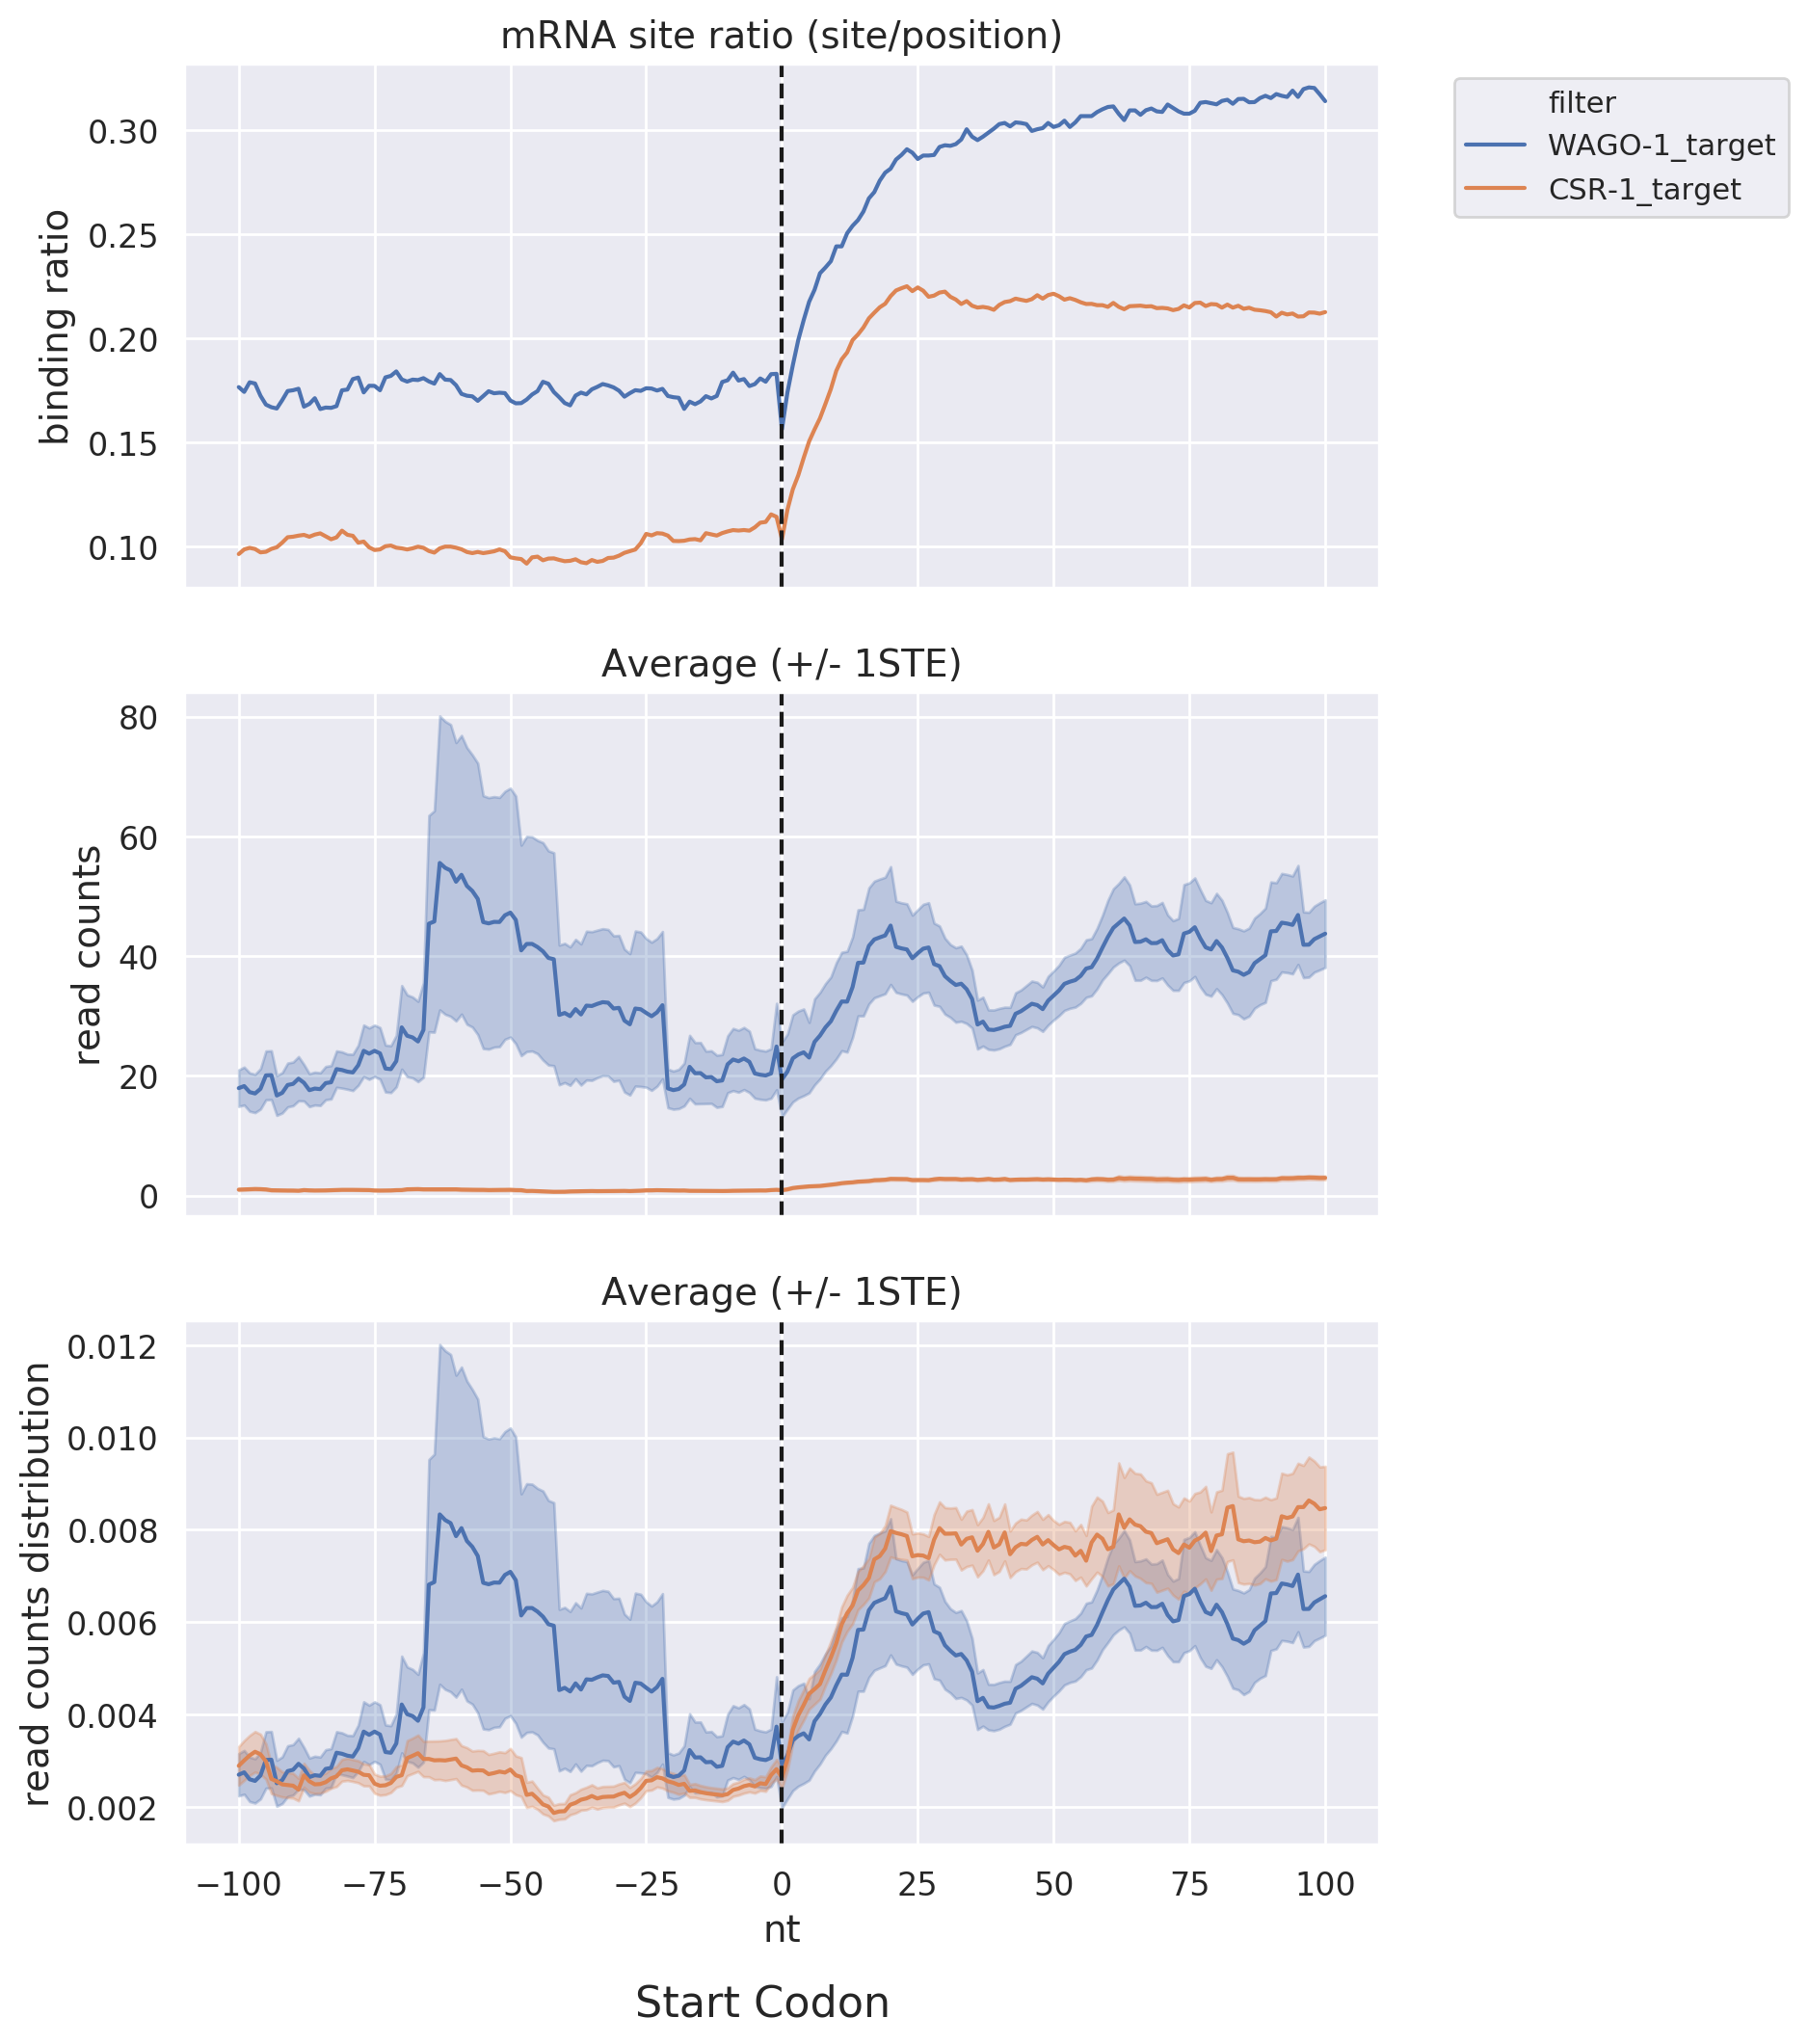
Start & Stop Codon: Shows read-count distribution near the start and stop codons within a specific
distance
via line graphs, facilitating comparisons among different datasets or target lists.
-
Fold Change: Compares fold-changes in sRNA read-counts binding to target RNAs between paired
datasets,
enabling
further comparison among different target lists or regions.
-
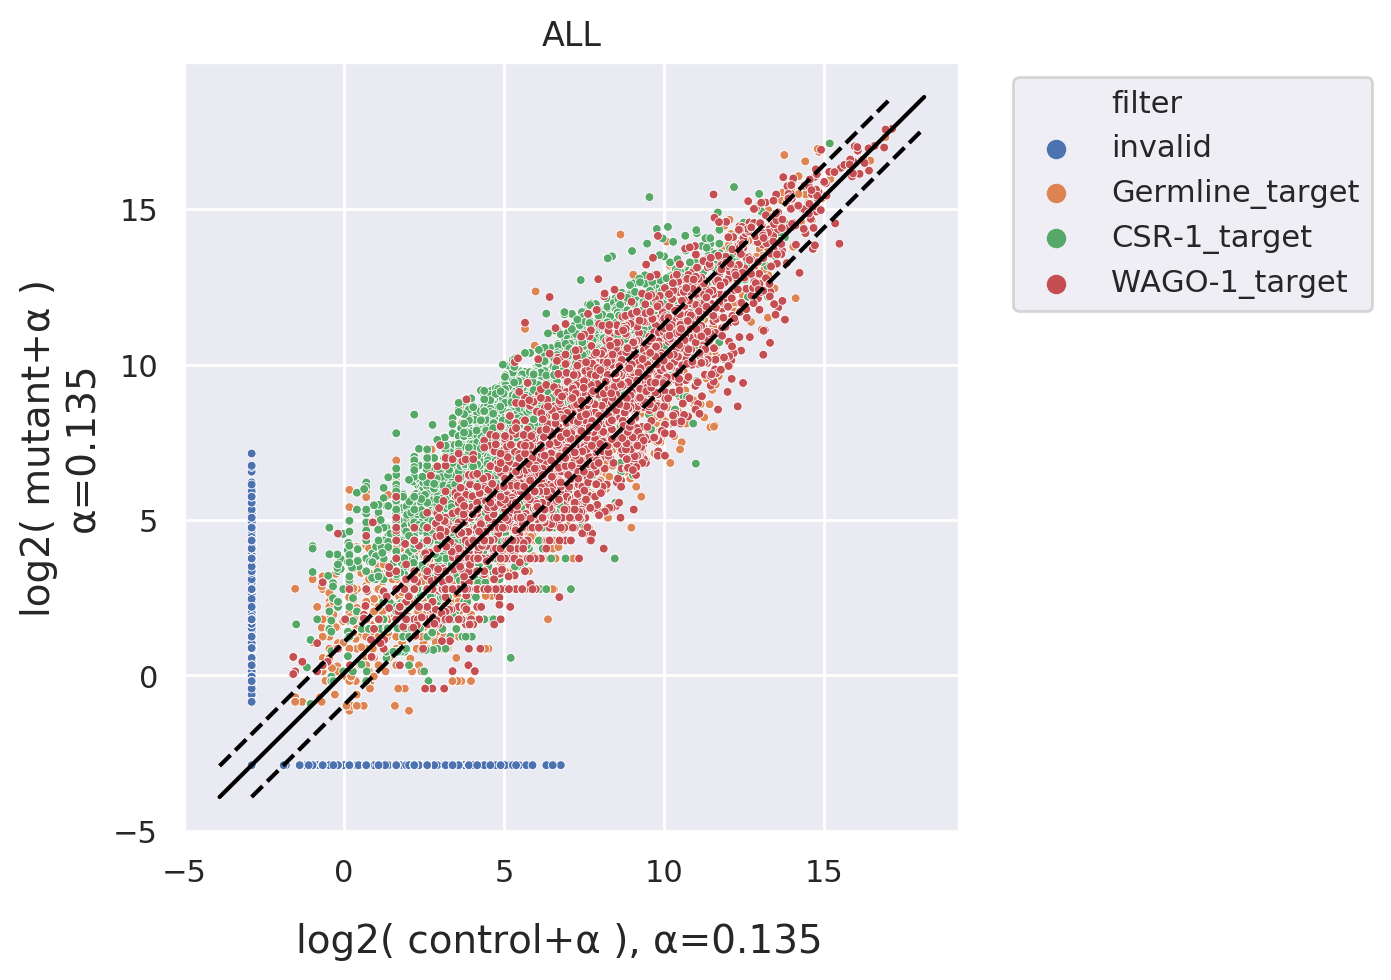
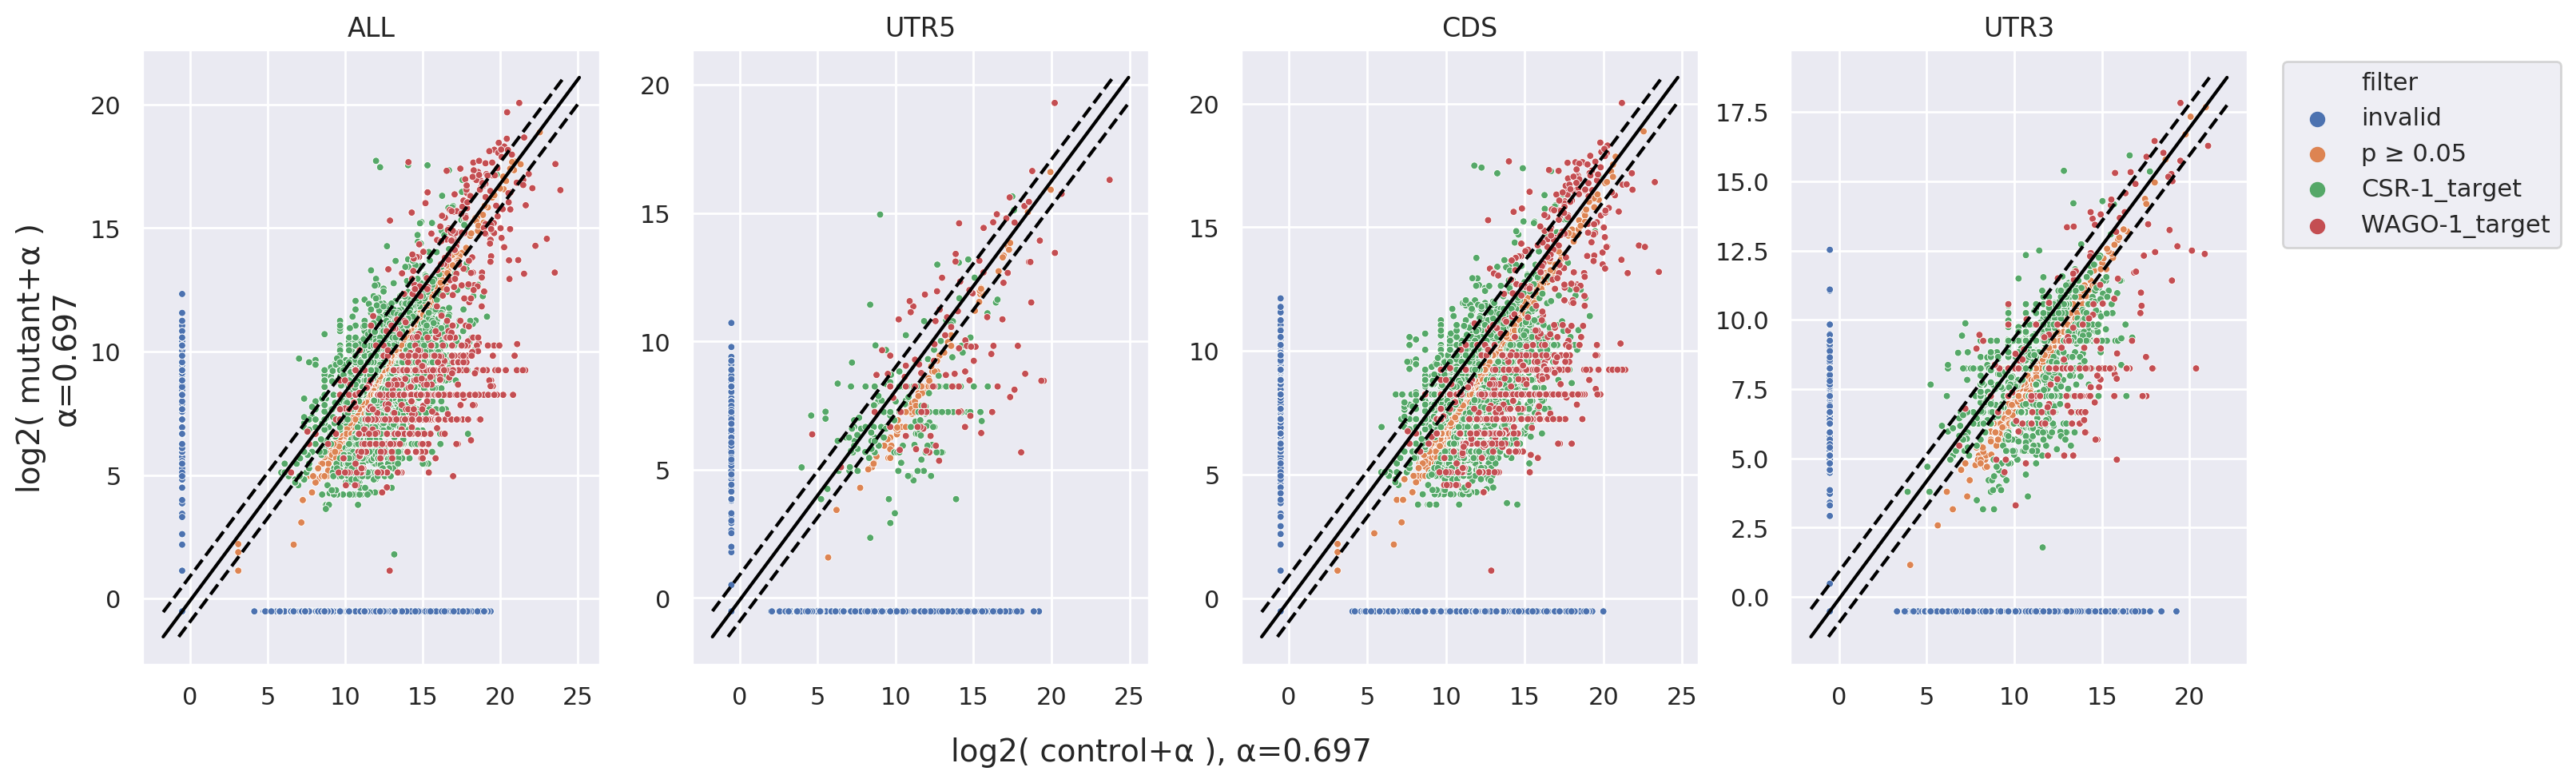
Scatter Plot: Similar to Fold Change, but presented as scatter plots. This visualization can further
annotate
target RNAs with a p-value using statistical markers.
Database Page
The Database page allows users to access common literature data, primarily focusing on C.elegans at present. Clicking on individual data fields enables users to download or view detailed information and external links, aiding in swiftly comparing their research findings with literature data.
- Dataset: Compressed files containing NGS data such as WAGO-1 IP, HRDE-1 IP, CSR-1 IP, PRG-1 CLASH, ALG-1 iCLIP, etc.
- Reference: Includes miRNAs from C.elegans, Homo sapiens, Mus musculus, Drosophila melanogaster, as well as some mRNA and ncRNA.
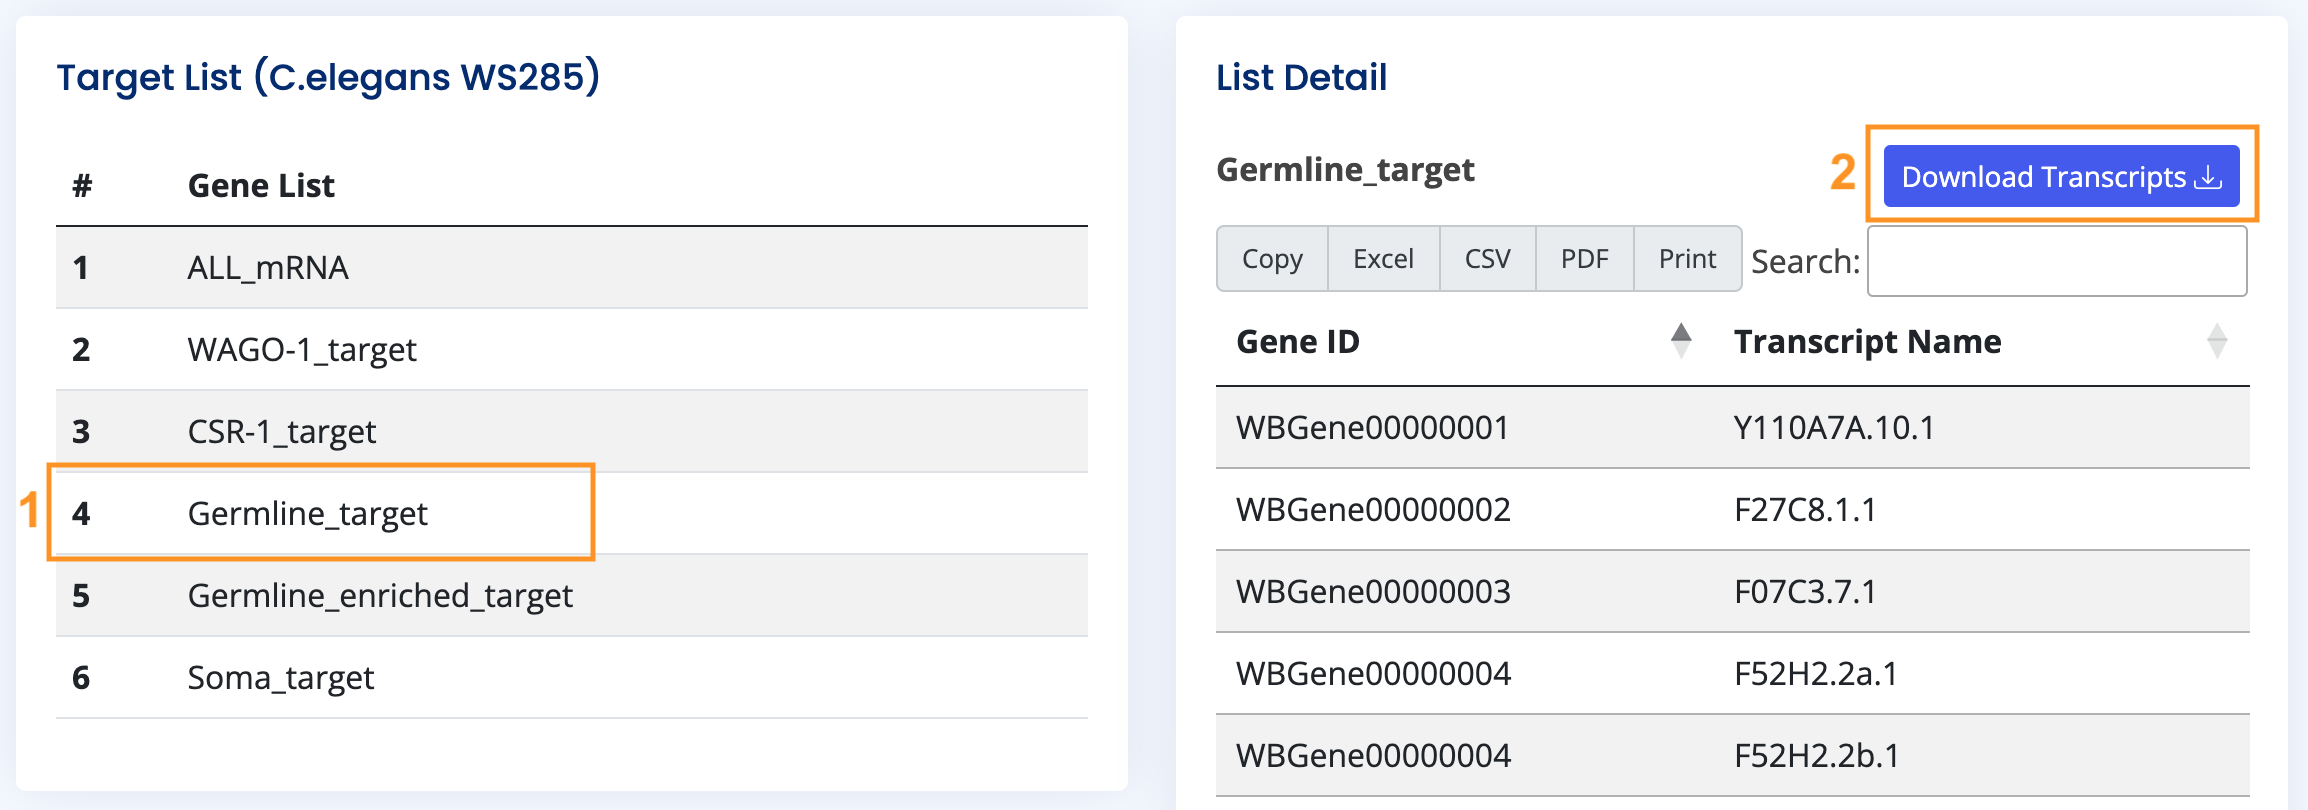
- Target List: Based on the WormBase WS285 version for C.elegans, comprising all mRNAs, WAGO-1 targets, CSR-1 targets, Germline targets, Germline-enriched targets, and Somatic targets.
Source Code
You can download the source code for the Command Line tool from here: https://github.com/RyanCCJ/sRNAanalyst
If you prefer to use the Docker version, you can download it from here: https://github.com/RyanCCJ/sRNAanalyst-docker